

|
|
|
|
www.dol.gov
|
| November 6, 2008 DOL Home > About DOL > FY 2006 Performance Budget Overview |
U.S. DEPARTMENT OF LABOR
|
|||||||||||||||||||||||||||||||||||||||||||||||||||||||||||||||||||||||||||||||||||||||||||||||||||||||||||||||||||||||||||||||||||||||||||||||||||||||||||||||||||||||||||||||||||||||||||||||||||||||||||||||||||||||||||||||||||||||||||||||||||||||||||||||||||||||||||||||||||||||||||||||||||||||||||||||||||||||||||||||||||||||||||||||||||||||||||||||||||||||||||||||||||||||||||||||||||||||||||||||||||||||||||||||||||||||||||||||||||||||||||
FY 2006 DOL Request |
|||
|
|
FY 2005 |
FY 2006 |
Change |
|
Discretionary: |
$12.0 |
$11.5 |
-$0.5 |
|
Mandatory: |
$38.7 |
$43.0 |
$4.3 |
|
Total |
$50.7 |
$54.5 |
$3.8 |
|
Full Time Equivalents (FTE) |
16,776 |
16,945 |
169 |
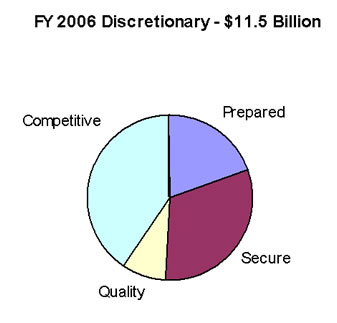
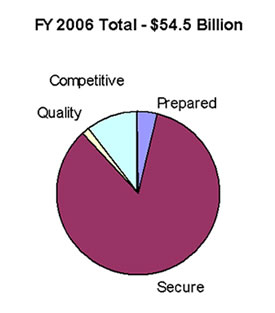
The following charts illustrate how the FY 2006 DOL Request supports
each Strategic Goal:
The Department has included several significant
increases in its FY 2006 submission that support the outcome goals identified
above.
The following table identifies selected initiatives, the increase requested, and the outcome goals they support:
|
Agency |
Initiative |
FTE |
Amount (000s) |
|
Outcome Goal 1.1 - Increase opportunities for employment, retention and earnings for new and re-emerging entrants to the workforce |
|||
|
ETA |
Prisoner Re-entry Initiative (second year) |
0 |
$15,200 |
|
VETS |
Homeless Veterans Reintegration Program (HVRP) |
0 |
$1,168 |
|
Outcome Goal 2.2 — Protect worker benefits |
|||
|
EBSA |
EFAST Refurbish System Hardware and Software |
0 |
$2,100 |
|
PBGC |
Continued Service to Participants in Trusteed Plans and to Pension Plan Practitioners |
0 |
$25,609 |
|
ESA |
Office of Labor Management Standards (OLMS) Enforcement |
48 |
$5,274 |
|
ESA |
Office of Labor Management Standards (OLMS) Union Advisory Services |
0 |
$726 |
|
ESA |
Federal Employees' Compensation Act (FECA) Central Bill Processing and Call Center Services |
0 |
$5,000 |
|
ESA |
Energy Employees Occupational Illness Compensation Program (EEOICP), Funds for NIOSH/HHS |
0 |
$55,768 |
|
Outcome Goal 3.1 — Reduce workplace fatalities, injuries, and illnesses |
|||
|
OSHA |
Improved Data for Analysis and Performance Measurement |
0 |
$1,000 |
|
OSHA |
Enhance State Plan Compliance Assistance programs |
0 |
$1,000 |
In addition, the FY 2006 DOL budget request includes major transfers of programs from other Departments to the Department of Labor and further consolidation of funding streams and accounts including:
The four strategic goals and supporting outcome goals are in turn supported by performance goals and measures. The performance goals form the basis of the annual targets and associated strategies and resource requirements and are presented in greater detail within the agency performance-budgets. The Department will measure the key agency goals identified below for determining performance accomplishment in FY 2006.
Strategic Goal 1 — A Prepared Workforce: Enhance opportunities for America's workforce
A strong national economy depends, in part, on preparing new entrants to the workforce, such as out-of-school youth and ex-offenders reentering society, to be qualified job candidates who possess the skills that are demanded by employers. Many industries and sectors of the economy will be adding new jobs in the coming years or transforming their business processes, requiring new and different worker skills. To ensure a prepared American workforce, innovative approaches to workforce development and strong partnerships between the workforce system, business and industry, and education and training programs will be required.
How well the Department performs in assuring A Prepared Workforce will be assessed by targeting accomplishments for programs and initiatives supporting these two broad outcomes:
Agencies supporting this strategic goal are the Employment and Training Administration, Veterans' Employment and Training Service, the Bureau of Labor Statistics, the Women's Bureau, the Office of Disability Employment Policy and the Civil Rights Center.
As stated in the Introduction section above, the Department's employment and training programs have been realigned between Strategic Goal 1 — A Prepared Workforce and Strategic Goal 4 — A Competitive Workforce. For A Prepared Workforce, this realignment now emphasizes the programs that are critical in developing workers with the skill and credentials necessary to fill current and emerging employment needs, while shifting those programs to A Competitive Workforce that directly respond to the changing needs of business by linking job seekers with employment opportunities in high-demand growth industries.
As a result of the shift of ETA performance goals from Strategic Goal 1 to Strategic Goal 4, it should be noted that this request is far lower than in prior years. Remaining in Strategic Goal 1 are the Apprenticeship, Veterans and Job Corps programs, all of which serve a large proportion of workers who may be new to the workforce. Moving to Strategic Goal 4 are the WIA state grant programs and the Trade Adjustment Assistance program, all of which serve workers seeking to utilize existing skills and perhaps enhance them in pursuit of new career opportunities. The WIA Youth program has been added to the proposed consolidation of WIA funding streams to more effectively and efficiently prepare people for the competitive workforce. Several ETA goals (e.g., Work Incentive Grants; Older Americans/SCSEP; and Indian and Native Americans) have been assigned to Strategic Goal 4.
For a prepared workforce, the Department will concentrate resources toward preparing those segments of the workforce that do not yet have the experience, skills or training needed to compete and succeed in their work life. In FY 2006, the Department proposes to dedicate $2.3 billion of its discretionary budget authority for agency-specific strategies supporting this strategic goal. These strategies include $1.6 billion for training and employment programs in the Employment and Training Administration, $188 million for training and employment programs targeted at veterans through the Veterans' Employment and Training Service, and $542.5 million for funding dedicated to improving the effectiveness of information and analysis on the U.S. economy in the Bureau of Labor Statistics.
Outcome Goal 1.1 has been reframed this year to emphasize preparing new entrants to the workforce. A critical aspect in ensuring a prepared workforce is developing a pipeline of workers with the skills and credentials necessary to fill the jobs of the 21st century. Strengthening the registered apprenticeship program, which responds directly to the demands of the labor market, and re-entrants to the civilian workforce including personnel separating from the military will ensure that skilled workers are continually entering productive careers and accessing job opportunities in growth industries.
Increases in the FY 2006 request supporting this outcome goal include:
Strategies for Outcome Goal 1.1 include:
The performance measures and indicators related to this outcome goal evaluate the results of our employment and training services — they address whether new and re-emerging participants obtain employment, remain employed, and receive higher wages.
Outcome Goal 1.1 — Increase opportunities for employment, retention and earnings for new and re-emerging entrants to the workforce
|
Performance Goal DOL-06-1.1A: Strengthen the registered apprenticeship system to meet the training needs of business and workers in the 21st Century (ETA) |
|
Indicators*: The program will use common measures of entered employment, retention, earnings, and cost per participant (efficiency)
Baseline: TBD in FY 2005 * The Bureau of Apprenticeship and Training is moving to adopt measures consistent with the common measures, but using the Apprenticeship reporting system and not UI wage records at this time. Note: Because apprentices are employed by definition, no entered employment measure is proposed for apprenticeship programs. **23 states are federally-registered apprenticeship programs and enter data on individuals into the Registered Apprenticeship Information System (RAIS). A group of “tracked entrants” is defined as the cohort of apprentices registered and entered into RAIS during a given reporting period. ***This is an estimate which may be revised using FY 2005 baseline data. |
|
Performance Goal DOL-06-1.1B: Improve educational achievements of Job Corps students, and increase participation of Job Corps graduates in employment and education (ETA) |
|
Indicators:
Baseline: Not available |
|
Performance Goal DOL-06-1.1C: Assist ex-offenders in successful reintegration into the community and workforce (ETA) |
|
Indicators: The program will use common measures of entered employment, retention, earnings, and cost per (efficiency), as well as a measure of recidivism, yet to be determined
Baseline: PY 2005 * Measure to be defined in PY 2005 |
|
Performance Goal DOL-06-1.1D: Improve the employment outcomes for veterans who receive One Stop Career Center services and veterans' program services (VETS) |
|
Indicator: Veterans and Disabled Veterans: Employment after program exit Baseline: Not Available* Indicator : Veterans and Disabled Veterans: Retention in employment after program exit Baseline: Not Available* Indicator: Homeless veterans (subpopulation): Employment after program exit for homeless veterans participating in the Homeless Veterans' Reintegration Program (HVRP). Baseline: Not Available* Indicator: Homeless veterans: Retention in employment after program exit for homeless veteran HVRP participants. Baseline: Not Available* Indicator: Homeless veterans: Cost per homeless veteran HVRP participant. Baseline: Not Available* During PY 2005, DOL will initiate collection of baseline performance data consistent with the new Common Measures for federal job training and employment training programs and will adjust or establish FY 2006 targets, as baseline results become available. *Baseline data that comply with the definitions and specifications applicable under the Common Measures have not yet been collected. Efficiency measures are under development for all other programs. |
Outcome Goal 1.2 — Improve the effectiveness of information and analysis on the U.S. economy
The 21st Century requires public officials, business owners, and private citizens to be knowledgeable about trends in the global, national, and local economies. They must have access to up-to-date, high-quality information and statistics to formulate public policy, negotiate a purchasing agreement, or decide what field to pursue as a career. In all of these cases, people need sound data to make sound decisions.
The Department plays a crucial role in public and private decision-making processes by producing statistics that are relevant, timely, and accurate. Using the strategies described below, the Department will identify the most promising types of improvements, ranging from changing a statistical methodology to expanding the geographical scope of a data series to designing an entirely new survey. In addition, the Department will identify ways to improve the accessibility and usability of the data through enhanced dissemination methods.
Strategies for Outcome Goal 1.2 include:
The performance measures for this outcome goal highlight the accomplishments of the programs. More specifically, the Department's statistical programs produce detailed information about the labor force, prices, compensation, and productivity that individuals, corporations, and public policymakers rely upon. A desirable outcome for a major statistical agency is the ability to aid its customers in both the public and private sectors to make better-informed decisions.
The OMB-sponsored Interagency Council on Statistical Policy's Guidelines for Reporting Performance by Statistical Agencies provides guidance on measuring and reporting on statistical program performance. Relevancy, timeliness, and accuracy are identified as critical aspects of performance as is achieving customer satisfaction with statistical products and services. Statistical programs need to be improved as shown through setting ambitious targets for relevancy, timeliness and accuracy measures. All of these efforts support and track progress in improving information available to decision-makers.
Outcome Goal 1.2 — Improve the effectiveness of information and analysis on the U.S. economy
|
Performance Goal DOL-06-1.2A: Improve information available to decision-makers on labor market conditions, and price and productivity changes (BLS) |
|||
|
Performance Measures |
Performance Targets |
||
|
Improve information available to decision-makers on labor market conditions, and price and productivity changes |
'04 |
'05 |
'06 |
|
|
|
|
|
|
Improve relevancy
|
8 |
9 |
12 |
|
|
|
|
|
|
Improve accuracy
|
59.2% |
75.7% |
76.0% |
|
Improve accuracy
|
58.0% |
58.3% |
58.5% |
|
Enhance information technology
|
17% |
40% |
60% |
|
Enhance efficiency and effectiveness
|
$6.13 |
$3.32 |
$3.24 |
|
Raise customer satisfaction with BLS products and services (e.g., the American Customer Satisfaction Index) [2001 baseline = 74%]1 |
82% |
75% |
|
|
Deliver economic data on time (Percent of scheduled releases issued on time.) [2000 baseline = 99%] |
96% |
100% |
100% |
|
Percent of accuracy measures met (e.g., revision, coverage, etc.) [2000 baseline = 94%]2 |
83% |
100% |
100% |
1In 2004, the BLS measured users' satisfaction with the
Occupational Outlook Handbook Web site. For 2006, BLS will set new
targets for this measure due to changing its measure of users' satisfaction
from electronic news subscribers to users' satisfaction with its OOH
website.
2Beginning in 2005, response rates are no longer
reflected in this aggregate measure.
Strategic Goal 2 — A Secure Workforce: Promote the economic security of workers and families
Central to the DOL mission are retirement security; compliance assistance and enforcement toward protecting workers' wages and working conditions; providing unemployment compensation and other benefits when workers are unable to work; and expanding, enhancing, and protecting workers' retirement plans, health care plans, and other benefits. The strategic goal of A Secure Workforce captures these priorities and consists of two outcome goals, which focus on safeguarding employees' wages, working conditions, and union democracy and financial integrity; and assistance in the form of unemployment, disability, and pension and health care insurance benefits.
Agencies supporting this strategic goal are the Employment and Training Administration, the Employment Standards Administration, the Employee Benefits Security Administration, and the Pension Benefits Guaranty Corporation.
The Department proposes $3.4 billion of discretionary budget authority in FY 2006 to conduct programs and activities that support A Secure Workforce. These programs include $2.7 billion for state unemployment insurance administration and other ETA programs, $602.7 million for ESA workforce protection programs, $137 million for EBSA to protect the nation's pension and health insurance system, and $297 million of mandatory funds for PBGC to provide payments to participants in terminated defined-benefit pension plans and assist at-risk multiemployer plans.
While our commitment to worker protection is steadfast, our approach focuses on expanding compliance assistance initiatives to help employers comply with the Department's regulations. Compliance assistance, combined with a strong enforcement program targeted to the most hazardous worksites and industries, will help prevent violations, leverage the Department's resources, and position the DOL to deal with emerging challenges.
Protecting vulnerable populations, and protecting and expanding pension and health care coverage will continue to be key issues. Continuing changes in the U.S. economy are not expected to remove or lessen workers' risk of experiencing unemployment in our dynamic market economy, so the unemployment insurance (UI) system must continue to adapt to the changing character of the workforce, job market, and nature of unemployment itself. The FY 2006 budget includes a UI legislative proposal that strengthens the financial integrity of the UI program and will reduce erroneous payments, keep state UI taxes down, and improve the solvency of the trust fund that finances UI benefits. In addition, the 2006 Budget funds two UI program integrity initiatives that will help states prevent UI identity theft and assist claimants to return to work.
The continued growth in internet use and increased networking capabilities have encouraged American businesses to shift from traditional “brick and mortar” organizational structures to business operations with lines of authority stretching across the globe. Traditional methods of tracking, analyzing, and reporting on employer personnel practices often do not align with current business models. In addition, the Nation will increasingly rely on foreign workers to fill employers' needs in low-wage, labor-intensive industries such as agriculture, garment, health care, guard and janitorial services, restaurants, hotel/motels and day-haul. Low-wage industries that employ large numbers of vulnerable workers, including young workers, are characterized by consistently high violation rates of minimum wage, overtime and child labor requirements. Protecting the most vulnerable workers will continue to be a key focus.
Achieving health care and retirement security is becoming more complex, due to changing workforce characteristics and economic conditions. Both employees and employers are facing rising health care costs, further emphasizing the need for affordable, secure health coverage. In addition, the once-common defined benefit pension plan is giving way to defined contribution plans — pre-tax individual savings accounts such as 401(k)s. For workers, this shift means taking on more responsibility for retirement savings and planning, including making investment decisions and managing investment risks.
The profile of workplace injuries has changed along with the changing economy, requiring new disability management and vocational rehabilitation approaches. In some Federal agencies, the number of jobs available to recovering injured workers is declining and the average age of workers is rising. In general, a 21st century Federal workforce will require that its workers upgrade their skills. These factors make assisting return-to-work and reducing disability time loss in workers' compensation cases a greater challenge for the Department.
Outcome Goal 2.1 — Increase compliance with worker protection laws
The Department is committed to guaranteeing an honest day's pay for an honest day's work for employees — particularly the most economically disadvantaged and vulnerable workers. This includes administration of the Fair Labor Standards Act (FLSA), which establishes minimum wage, overtime pay, recordkeeping, and child labor standards affecting full-time and part-time workers. This also includes administration of the Migrant and Seasonal Agricultural Worker Protection Act (MSPA), which regulates the hiring and employment activities of agricultural employers, farm labor contractors, and associations using migrant and seasonal agricultural workers. Through its administration and enforcement of the Labor-Management Reporting and Disclosure Act (LMRDA), the Department ensures union democracy, financial integrity and transparency.
Strategies for Outcome Goal 2.1 include:
The performance goals associated with this outcome goal are: American workplaces legally employ and compensate workers and ensure union financial integrity, democracy and transparency.
Outcome Goal 2.1 — Increase compliance with worker protection laws
|
Performance Goal DOL-06-2.1A: American workplaces legally employ and compensate workers (ESA) |
|
Indicators:Covered American workplaces legally,
fairly, and safely employ and compensate their workers by:
Baseline FY 2004: 189 Reduce employer recidivism:
Baseline FY 2004: 71% Increase compliance in industries with chronic violations.
Baseline: Establish in FY 2005 Ensuring timely and accurate prevailing wage determinations:
Baseline: 1,491
Baseline FY 2002: 100% |
|
Performance Goal DOL-06-2.1B: Ensure union financial integrity, democracy, and transparency (ESA) |
|
Indicators:
Baseline FY 2004: 9%
Baseline: TBD in FY 2005
Baseline: 73% * Baseline must be re-measured because of union reporting changes that will be effective in FY 2006 |
Outcome Goal 2.2 — Protect worker benefits
Protecting workers' benefits is a key component of the Department's goal to promote the economic security of workers and their families. Strategies address a number of new issues affecting unemployment, foreign labor, and employee benefits. For example, the Administration projects that unemployment will decline to 5.1 percent by FY 2007. However, a smaller proportion of unemployment claims are expected to be as a result of layoffs, and therefore claims may be more likely to contain eligibility issues and errors.
Specific increases in the FY 2006 request supporting this outcome goal include:
Depending on the rate of economic recovery and the performance of financial investment, more pension plans may be trusteed under the administration of the Pension Benefit Guaranty Corporation over the next five years. In addition, the transition of more Americans to 401(k) and managed health care plans will place more of the burden for retirement savings and health care choices on employees. Finally, the workers' compensation programs administered by DOL face the same challenge as the Nation. An increasingly aging population and rising health care costs will increase the focus on these programs, resulting in efforts to improve program efficiency.
Strategies for Outcome Goal 2.2 include:
Performance goals associated with this outcome goal are Make timely
and accurate payments to unemployed workers and facilitate their reemployment;
Minimize impact of work-related injuries; Enhance employee pension and health
benefits security; and Improve pension payment
processing.
Outcome Goal 2.2 — Protect worker benefits
|
Performance Goal DOL-06-2.2A: Make timely and accurate benefit payments to unemployed workers and facilitate their reemployment (ETA) |
|
Indicators:
Baseline (FY 2001): 89.1%
Baseline (FY 2001): 57.9%
Baseline: (FY 2001): NA
Baseline (FY 2001): 79.1% *First payment time lapse is measured as the number of days between the last day of the first week of unemployment for which a claimant is eligible for a UI payment and the date the first payment is made. Based on regulation at 20 CFR 640, in the 42 states for which the first eligible week is a non-compensable “waiting week,” a payment is timely if made within 14 days of the end of the first week that is compensable. In the other 11 states, a payment is timely if made within 21 days. This rule gives both sets of states 21 days to process a timely payment. ** Subject to approval for data collection in FY 2006. |
|
Performance Goal DOL-06-2.2B: Minimize the impact of work-related injuries (ESA) |
|
Indicator: For FECA cases of the United States Postal Service, achieve a lost production days (LPD) rate (LPD per 100 employees) of 146 days. Baseline FY 2003: 147.6 days |
|
Indicator: For FECA cases of All Other Government Agencies, achieve a lost production days rate (LPD per 100 employees) of 60 days. Baseline FY 2003: 56 days |
|
Indicator: Through staff-initiated evaluation of cases under Periodic Roll Management for changes in medical condition and fitness for duty, produce $X million in savings in FY 2006 Baseline: NA |
|
Indicator: The trend in the indexed cost per case of FECA cases receiving medical treatment will remain below the comparable measure for nationwide health care costs. Baseline: Milliman U.S.A. Health
Costs Index |
|
Indicator: Achieve targets for five communications performance areas. Targets: Meet at least four of the
five following targets: |
|
Indicator: Reduce the average time required to resolve disputed issues in Longshore and Harbor Worker's compensation Program contested cases (New measure in 2005). Baseline FY 2005: TBD |
|
Indicator: Increase by 11 percent above the baseline the average percent of Black Lung benefit claims for which following an eligibility decision by the district director, there are no requests for further action pending one year after the date the claim is filed. Baseline FY 2001: 66.5% |
|
Indicator: Increase initial claims for benefits in the Part B Energy Program that are processed within standard timeframes. Baseline: 75% |
|
Indicator: Increase the percent of Final Decisions in the Part B Energy Program that are processed within standard timeframes. Baseline: 75% |
|
Indicator: Issue payments or final decision on X% of Part E claims previously filed with the Department of Energy under Part D. Baseline: TBD |
|
Performance Goal DOL-06-2.2C: Enhance Employee Pension and Health Benefits Security (EBSA) |
|
Indicators:
Baseline (FY 1999-2001 Average):
46.04%
Baseline (FY 1999-2001 Average):
23.45%
Baseline FY 2003: 59
Baseline (FY 2001-2003 Average):
7,564 |
|
Performance Goal DOL-06-2.2D: Improve service to pension plan customers (PBGC) |
|
Indicators:
Baseline FY 2002: 69 |
Baseline FY 2001: 73 |
Strategic Goal 3 — Quality Workplaces: Foster quality workplaces that are safe, healthy and fair
The goal of quality workplaces requires that American work environments are safe, healthy, and fair. Achievement of this goal requires the use of complementary strategies of the compliance assistance, enforcement, and education, outreach, and training. Each of the Quality Workplaces goal elements are further defined with results targets in two broad outcome goals:
Agencies supporting this strategic goal are the Occupational Safety and Health Administration, the Mine Safety and Health Administration, the Employment Standards Administration, and the Veterans' Employment and Training Service.
OSHA and MSHA represent the agencies with the largest share of the Department's budget resources dedicated to supporting Quality Workplaces. In FY 2006 the Department requests $1.0 billion in discretionary budget authority to support this strategic goal, including, $467 million for OSHA programs and $280.5 million for MSHA programs.
Significant progress has been made in protecting workers from occupational safety and health threats. In the past thirty years, workplace fatalities have been cut in half and occupational injury and illness rates have declined forty percent. However, the Department continues to confront a variety of challenges. The number of workers DOL is responsible for protecting has expanded dramatically, nearly doubling between during this period, from 58 million workers at 3.5 million worksites to 108 million workers at seven million establishments. Rapid technological advances and dynamic workplace environments have changed the nature of work, creating new health and safety challenges. For example, emerging safety and health threats include fall hazards from wireless communication and HDTV tower construction and occupational asthma and exposures to new chemicals. The Department's strategies for reducing workplace hazards have not traditionally addressed these segments of the workforce. Changes in workplace demographics create an increasing challenge to work place safety and health — the increase of immigrant and hard-to reach workers, a growing percentage of young workers, those continuing to work at an older age, and the rapidly increasing number of temporary workers.
The mining environment, whether underground or surface, is complex and ever-changing. Unseen geologic instabilities, constantly changing terrain, and the prevalence of large and complex haulage and mining equipment are a few of the factors that make maintaining mine safety a continuing challenge.
Equality and fair play are central values in our national life. DOL promotes these values through its administration of anti-discrimination and equal employment opportunity regulations for Federal contractors and subcontractors, who employ more than 20 percent of the labor force in America or approximately 26 million workers. Many Federal contractors have demonstrated their commitment to equal opportunity and have adopted inclusive human resource policies and procedures at all levels. Notwithstanding this past success, discrimination still exists in the workplace and Federal contractors may still need assistance to meet their affirmative action obligations.
Improving the safety and health of the American workplace must be done in partnership with workers, employers, and other levels of government. Each shares responsibility to seek out and employ the best workplace safety practices as the conditions and demands of an evolving economy warrant.
Outcome Goal 3.1 — Reduce workplace injuries, illnesses, and fatalities
The Department strives to make American workplaces the safest in the world. Over the last several years, the Department has sought to create a commitment to workplace safety and health by both employers and workers. We are encouraged by the progress that they have made in reducing workplace injuries and illnesses. Nevertheless, significant hazards and unsafe conditions continue to exist in the workplace. According to the National Institute for Occupational Safety and Health, businesses spend $171 billion a year on costs associated with occupational injuries and illnesses, expenditures that come straight out of company profits.
The Department will reach and maintain a healthy balance among enforcement, education and training, which includes compliance assistance and technical support, while improving our leadership role in the national safety and health dialogue, expanding outreach, and expanding opportunities for voluntary and cooperative programs. We will work to ensure that employers have access to DOL resources to assist them in preventing workplace injuries and illnesses. DOL plans to identify the most critical safety and health problems and create strategies to address them. The FY 2006 request for OSHA includes an increase of $1.0 million for improved data for analysis and performance measurement, which is necessary for more meaningful and proactive strategic management planning; and $1.0 million to enhance State Plan compliance assistance services and activities.
Strategies for Outcome Goal 3.1 include:
The performance goals related to this outcome goal directly measure reductions in workplace injuries, illnesses and fatalities, across general industries and specifically mining. Exposures to health hazards, such as noise and respirable dust, are also measured in the mining industry.
Outcome Goal 3.1 — Reduce workplace injuries, illnesses, and fatalities
|
Performance Goal DOL-06-3.1A: Reduce work-related fatalities (OSHA/MSHA) |
|
Indicator: Reduce the rate of workplace fatalities by 9 percent from baseline (for sectors covered by the Occupational Safety and Health Act) (OSHA) Baseline: 1.62 fatalities per
100,000 workers (FY 2000 — 2002 average) |
|
Indicator: Reduce the mine industry fatal injury incidence rate by 15 percent from the baseline by the end of FY 2008 (MSHA) Baseline (FY 2003): 0.0229
fatalities per 200,000 hours worked |
|
Performance Goal DOL-06-3.1B: Reduce work-related injuries and illnesses (OSHA/MSHA) |
|
Indicator: Reduce the rate of workplace injuries and illness by 12 percent from baseline (OSHA) Baseline: 1.6 days away from work
cases per 100 workers (CY 2002) |
|
Indicator: Reduce the mine industry all-injury incidence rate by 50 percent from the baseline by the end of FY 2008 (MSHA) Baseline FY 2000: 5.07 |
|
In the mine industry, improve miner health by implementing the following Indicators: Indicators:
Baseline: FY 2003/2004 :
10.7%
Baseline: TBD
Baseline: TBD
Baseline: TBD * Targets are under revision because FY 2003 and FY 2004 results greatly exceeded performance targets. |
Outcome Goal 3.2 — Foster equal opportunity workplaces
DOL is committed to fostering workplaces that are free of discrimination and that guarantee equal opportunities and fairness to working Americans. The Department monitors Federal contractors compliance with applicable laws and executive orders, and ensures that minorities, women, individuals with disabilities, and eligible veterans are afforded an equal opportunity to compete for employment and advancement. The Department believes that the best method to achieve equal opportunity workplaces is by focusing resources on finding and resolving systemic discrimination, a pattern or practice of unlawful discrimination involving a significant number of workers. The Department has developed goals that emphasize the use of compliance assistance as a component of its enforcement strategy for informing Federal contractors of their obligations and in helping Federal contractors comply with those requirements. The Department also protects the civilian employment rights and opportunities of members and veterans of our military services.
Strategies for Outcome Goal 3.2 include:
The performance goals related to this outcome goal measure decreases in employment discrimination rates among Federal contractors resulting of OFCCP activities, and the extent to which program activities lower the barriers faced by military personnel in the civilian workforce. Achieving these goals will help ensure that all of America 's workers have equal opportunities to compete for and achieve rewarding employment free of discrimination.
Outcome Goal 3.2 — Foster equal opportunity workplaces
|
Performance Goal DOL-06-3.2A: Federal contractors achieve equal opportunity workplaces (ESA) |
|
Indicator: Reduce the incidence of discrimination among Federal contractors. Baseline FY 2001: 12.5% * Targets are under review. |
|
Indicator: Increase compliance among Federal contractors in all other aspects of equal opportunity workplace standards. Baseline FY 2001: 57% * Targets are under review. |
|
Performance Goal DOL-06-3.2B: Reduce employer-employee employment issues originating from service members' military obligations conflicting with their civilian employment (VETS) |
|
Indicator: Percent USERRA cases conducted in an effective manner as defined by procedural guidelines and by substantive analysis Baseline: TBD (FY 2005)* *A target for the USERRA quality measure for PY 2006 will be established on the basis of the baseline results to be collected during PY 2005. Indicators:
Baseline (FY 2004): 84%
Baseline (FY 2004): 91%
Baseline (FY 2004): 99% |
Strategic Goal 4 — A Competitive Workforce: Maintain competitiveness in the 21st Century economy
This last strategic goal, A Competitive Workforce, addresses the issues facing us as the Department adapts and prepares to capture the vision of the Department's 21st Century Workforce initiatives and consists of two outcome goals:
Our first outcome goal — Build a demand driven workforce system to address worker shortages and equip workers to adapt to the competitive challenges of the 21st century — focuses on workforce gaps that are likely to occur, including labor shortages for new and replacement workers, with an emphasis on knowledge workers. The second — Promote job flexibility and minimize regulatory burden — focuses on adopting innovative approaches for establishing an effective regulatory environment and expanding workplace flexibility that are consistent with the changing nature of work in the 21st Century. This goal is supported by the full complement of DOL agencies.
Our country's economic development and global competitiveness depend on the competitiveness of our workforce. To succeed, our policies must embrace the emerging changes in our economy — in how we actually work, where we work, what skills we need, and how we balance our professional and family lives.
While employers and workers bear ultimate responsibility for adapting to these challenges, DOL has a leadership responsibility to support the needs of the changing workforce and position the U.S. for continued economic development and growth. The knowledge-based workplace will require a higher level of technical skills creating opportunities for many to succeed, but carrying the potential for some to fall farther behind. At the same time, an increasingly competitive and global economy will put pressure on our regulatory environment. Historically, we developed our labor policies and programs under conditions of labor surpluses and based our employment laws and regulations on traditional, full-time, long-term work arrangements. Over the next two decades, the relevance of these, and other assumptions will be challenged.
For a competitive workforce the Department will concentrate resources on those workforce segments that have work experience and skills, but who also need skill upgrades, desire to shift industries or occupations, or need help in readjusting to the changing economy.
The Department requests $6.1 billion in discretionary budget authority in FY 2006 for programs that strive to maintain competitiveness in the 21st Century economy. This funding level in Strategic Goal 4 is primarily due to the shift of ETA resources associated with Strategic Goal 1 in prior year performance budgets, namely the WIA Plus Consolidated Grant program. This new alignment supports the Secretary's priorities and focus for A Competitive Workforce.
As the 21st Century unfolds, the American workforce will evolve to something different. Two powerful forces will transform the workforce and the manner in which we work:
These forces have significant implications for our economy and the way DOL approaches its mission. Our challenge is to anticipate these changes to ensure that our programs and regulatory processes address contemporary work environment issues in a forward-looking way that contributes to economic growth, changing technology, and the changing workplace.
Our future prosperity demands the world's most skilled and productive workforce. A key aspect of meeting this challenge involves the long-term shift from goods-producing to service-producing employment associated with the decline in manufacturing employment and the dramatic increase in the demand for knowledge workers — people whose jobs require formal and advanced schooling. Knowledge workers now account for a third of the American workforce, outnumbering factory workers by two to one. The demand for knowledge workers is outpacing supply, resulting in attractive, high-paying jobs going unfilled. When companies do not find the talent they need within our borders, they seek it abroad. Global competition will reinforce the economic premium on knowledge workers, leaving low or unskilled U.S. workers increasingly vulnerable.
The shift to knowledge work will reinforce the ongoing trend of “non-traditional” work arrangements. Today, few workers can count on spending their entire careers within one company. A recent BLS press release from the National Longitudinal Survey states that “individuals held an average of 10.2 jobs from ages 18-38.” Full-time, stable, long-term employment arrangements will continue to decline. Instead, a growing number of workers will be part-timers, temporaries, consultants, or contractors.
Competing demands for Americans' time are also increasing. Among the world's industrialized nations, only the workers of Australia and Korea report working more hours than American and Japanese workers. Many workers are struggling to meet their family obligations, which have expanded in many cases to taking care of their elderly parents. Consequently, the need to balance work demands and home life will continue to be a growing concern.
DOL has made significant progress advancing labor issues for many years. However, for us to provide essential leadership to meet future challenges, we are shifting to a more forward-looking role that emphasizes:
The nation's future success will largely depend on our ability to continue to meet the needs of employers for new and skilled workers. To this end, DOL is committed to ensuring that the workforce investment system is responsive to the changing needs of business and is focused on linking job seekers with opportunities in high growth industries. DOL will strengthen partnerships among the workforce system, business and industry, education and training providers, and economic development agencies. These partnerships are critical to understanding the skills demanded by the labor market and will enable the Department to make informed investments in job training. Furthermore, DOL will take the necessary steps to ensure that the tools and information needed to understand emerging workforce issues are available. Finally, to maintain the nation's competitiveness, the workforce investment system will reach out to available workers, particularly in special target populations, so that there are enough skilled workers to fill the jobs of the 21st century.
The Department's ability to contribute to maintaining a competitive workforce will be assessed through our efforts to: develop more responsive workforce information by establishing a research and information analysis agenda that contributes to our ability to forecast emerging workforce issues; address worker shortages in sectors of the American economy; and, build a demand-driven workforce system, with particular emphasis on assisting high growth industries. Included in this outcome goal is $250 million for a second year of funding of the President's Community College Initiative to provide Community Based Job Training Grants.
The youth population is once again a growing segment of our population. The majority of jobs will continue to require workers who have acquired knowledge and skills via two-year colleges, vocational training, moderate to long-term on-the-job training and real work experience. The result for those who do not obtain the education and skills that the workplace demands is quite clear. Since 1979, according to 2003 BLS data, high school drop-outs are three times more likely to be unemployed than college graduates, and real earnings of college graduates have increased 19 percent, while those of high school graduates fell 5 percent.
To make our programs more comprehensive and supportive of the needs of youth, adults, and business, we have adopted the following new principles and strategies to guide our programs:
Strategies for Outcome Goal 4.1 include:
Many of the challenges described in Outcome Goal 4.1 will impact the Nation more significantly in the years beyond the current strategic plan timeframe. The major activities realigned under Goal 4, including the consolidated WIA grant programs, Trade Adjustment Assistance, and the Senior Community Employment Service Program will use the common measures of entered employment, employment retention, earnings, and efficiency, as highlighted below.
|
Performance Goal DOL-06-4.1A: Improve opportunities for employment, retention, and earnings for youth, adults, and dislocated workers through a Consolidated WIA Program (ETA) |
|
Indicators (Primary)*:
Baselines: TBD * Proposed consolidation will require collection of new baseline information, including cost per individual, since the number of individuals and services provided is likely to change as a result of the consolidation. Dislocated workers includes those served by National Emergency Grants Indicators (Secondary):
Baselines: Baseline for the entered
employment/education and education attainment measures will be established in
PY 2005. The literacy/numeracy measure baseline will be established in PY
2006. |
|
Performance Goal DOL-06-4.1B: Assist workers impacted by international trade to better compete in the global economy through the Trade Adjustment Assistance Program (ETA) |
|
Indicators:
Baseline: FY 2001: 65%
Baseline: FY 2001: 90%
Baseline: FY 2001: 85%
Baseline: Note: while targets have been established for prior measures, FY 2006 is also the baseline year for common measures. |
|
Performance Goal DOL-06-4.1C: Assist older workers to participate in a demand-driven economy through the Senior Community Employment Service Program (ETA) |
|
Indicators:
Baseline:Common Measures baselines
will be established in PY 2004 and targets will be set in subsequent years |
|
Performance Goal DOL-06-4.1D: Address worker shortages through the Foreign Labor Certification Program (ETA) |
|
Indicators:
Baseline: 99%
Baseline: Collect baseline data in
FY 2005
Baseline: Collect baseline data in
FY 2005
Baseline: Collect baseline data in
FY 2005
Baseline: 70% |
|
Performance Goal DOL-06-4.1E: Build a demand-drive workforce system (ETA) |
|
The Community College Initiative/Community Based Job Training Grants will be funded for the first time in PY 2005, as authorized and appropriated through the FY 2005 Omnibus Appropriations Act. ETA intends to develop information collection systems to address the common measures of: Indicators:
|
ETA also operates programs for Native Americans, the disabled (Work Incentive Grants), and the proposed community based job training grants that also will use the common measures of entered employment, retention, earnings, and efficiency. Other significant undertakings by ETA include providing workforce information to business, workers, and education through the e-tools web services and an extensive research and evaluation program, as mandated under WIA. Details on these activities may be found in ETA portion of the FY 2006 ETA budget. ETA also administers several employment-based foreign labor certification immigrant and non-immigrant programs and has given priority to continuously improving program performance through process reengineering to achieve expeditious and cost-effective application processing.
Outcome Goal 4.2 — job flexibility and minimize regulatory burden
Many employers, to compete more effectively in the highly competitive global economy, have restructured their companies, downsized their workforces, and increasingly relied on non-traditional employment practices that include part-time, temporary, and contractor-supplied workers. Experts expect these non-traditional work arrangements to increase substantially in coming decades. It is estimated that within 25 years, half the people who work for an organization will not be on its payroll. At the same time, on average, Americans are working more hours and many have difficulty balancing work demands with their personal lives.
We need to promote the greater flexibility desired by workers and employers. This includes examining and possibly adjusting our regulatory environment — employment related laws, regulations and regulatory practices — in light of non-traditional work arrangements and the need to reduce regulatory burden. In particular, some regulations written decades ago may no longer be applicable or effective; they may impose costs on employers without yielding any corresponding benefits to the workforce.
Strategies for Outcome Goal 4.2 include:
The performance goal related to this outcome of promoting job flexibility and minimizing regulatory burden while protecting workers centers around taking a comprehensive and strategic approach toward our ability to influence the work environment and implement a new regulatory infrastructure. Many of the indicators represent key steps in analyzing the changes needed and are therefore more output oriented during the current strategic planning cycle. Outcome-oriented performance goals will be developed after new policies and programs have been implemented based on the results of the proposed evaluations.
Outcome Goal 4.2 — Promote job flexibility and minimize regulatory burden
|
Performance Goal DOL-06-4.2A: Maximize regulatory flexibility and benefits and promote flexible workplace programs (ASP) |
|
Wage and hour, worker safety, pension and health care regulations, to the greatest extent practicable, are performance-based and provide maximum flexibility to employers in developing a compliance approach. Indicator: FY 2006: Review identified significant regulations and develop revisions Target: Initiate rulemaking for revisions as appropriate |
|
New and current regulations maximize net benefits. Regulations that impose greater societal costs than benefits are revised, consistent with applicable governing statutes Indicator: FY 2006: Regulations identified for revisions for withdrawals as appropriate Target: Initiate rulemaking as appropriate |
|
DOL ensures compliance with its regulations in the most cost-effective manner. Non-cost-effective practices are modified or eliminated, consistent with governing statutes. Indicators:
Target: Reduce unit cost per enforcement action by X% |
Baseline: FY 2004: Develop best
practices studies |
Baseline: 2004% * Consistent with and contingent upon the passage of Association Health Plan legislation now pending before Congress. |
Meeting the President's Management Agenda
In 2001, the Office of Management and Budget (OMB) released the President's Management Agenda (PMA), designed to help agencies improve management performance. The five government-wide PMA initiatives are:
DOL is also participating in three program initiatives that apply only to selected Federal
Departments and Agencies:
In order to measure progress against demonstrated goals, OMB's PMA portfolio managers were asked to identify where they would be proud to be in their respective PMA components as of July 1, 2004 and yet again as of July 1, 2005. In turn, Federal agency leadership was tasked with identifying separate Proud to Be goals related to PMA implementation. The Department set ambitious but reachable goals for its PMA implementation, and as of the December 31, 2004 PMA scorecard, the Department of Labor remains near the top of all Cabinet Departments with four Green status scores on the five government-wide President's Management Agenda components — along with five Green progress scores. DOL also maintained a Yellow status and Green progress score for its implementation of the Faith-based and Community initiative.
|
Current Status |
Progress |
|
|---|---|---|
|
Human Capital |
Green
|
Green
|
|
Competitive Sourcing |
Yellow
|
Green
|
|
Financial Performance |
Green
|
Green
|
|
E-Government |
Green
|
Green
|
|
Budget & Performance Integration |
Green
|
Green
|
On December 14, 2004, the Department received two President's Quality Awards in the Strategic Management of Human Capital and Budget and Performance Integration — the highest recognition by the Federal Government for managerial excellence. However, we recognize our work on PMA implementation is far from over. We must still remain steady on the five government-wide PMA components — improving in implementation where we can. DOL has just begun to tackle the just-launched Federal Real Property Asset Management initiative, which was designed to apply management to underused and unneeded Federal real property. Further, DOL is also one of 15 Federal agencies responsible for implementing the Eliminating Improper Payments Program initiative that was just launched in August 2004. The initiative will combat the estimated $45 billion in annual improper payments government-wide.
Program Assessment Rating Tool (PART), and DOL’s 2006 PART Assessments
In preparation for the FY 2006 budget, seven Department of Labor programs were evaluated using the Program Assessment Rating Tool (PART). Additionally, two programs were re-evaluated. The outcomes of these evaluations underline DOL's efforts to produce results for American employees and employers. Of these nine programs, five were rated as Adequate and four were rated as Moderately Effective. These include two programs previously rated as Results Not Demonstrated: Employee Benefits and Security Administration and the Office of Federal Contractor Compliance Programs.
Programs Rated as Moderately Effective for FY 2006 Budget
Programs Rated as Adequate for FY 2006 Budget
The 21 DOL programs that have been evaluated from FY 2004 — FY 2006 through the PART process represent roughly half of its programs, with the remaining programs scheduled for evaluation in the next two budget cycles. The positive impact of PART on DOL management is evident in many ways, especially in program planning and internal evaluation. Together with the President's Management Agenda, the PART has created an incentive for a more transparent government. To cite one example, in response to PART recommendations each DOL program evaluated with the PART from FY 2004 — FY 2006 will now publicly report its performance in terms of efficiency. This will allow citizens to better understand the costs associated with a better prepared and more competitive workforce, a secure workforce, and quality workplaces.
|
DOL PART RATINGS AND RANKINGS* |
|||
|
Program |
FY 2004 Rating |
FY 2005 Rating |
FY 2006 Rating |
|
BLS |
Moderately Effective |
Effective |
|
|
ESA/FECA |
Moderately Effective |
|
|
|
OSHA |
Adequate |
|
|
|
EBSA |
Results Not Demonstrated |
|
Moderately Effective |
|
ETA/Trade Adjustment Act |
Results Not Demonstrated |
Ineffective |
|
|
ESA/OFCCP |
Results Not Demonstrated |
|
Adequate |
|
ETA/Dislocated Workers |
Results Not Demonstrated |
Adequate |
|
|
ETA/Youth Activities |
Results Not Demonstrated |
Ineffective |
|
|
ETA/Older Americans |
Results Not Demonstrated |
Ineffective |
|
|
ESA/Black Lung |
|
Moderately Effective |
|
|
ETA/UI Administrative Grants |
|
Moderately Effective |
|
|
MSHA |
|
Adequate |
|
|
ETA/Migrant & Seasonal Farmworkers |
|
Ineffective |
|
|
ESA/WHD Davis-Bacon Act |
|
Results Not Demonstrated |
|
|
ETA/Job Corps |
|
|
Moderately Effective |
|
ETA/Native Americans Program |
|
|
Adequate |
|
ETA/Employment Service |
|
|
Adequate |
|
ETA/Foreign Labor Certification (H-1B) |
|
|
Moderately Effective |
|
ETA/Foreign Labor Certification (PERM) |
|
|
Adequate |
|
PBGC |
|
|
Moderately Effective |
|
ILAB |
|
|
Adequate |
*Programs do not undergo a PART review each year; some programs receive a follow-up PART if additional information is considered significant.
Agency Efficiency Measures
As of June 14, 2004 Efficiency Measures have been substantially developed for all programs and have been included in agency budget submissions, per the requirements of the President's Management Agenda. The Department will continuously improve overall program effectiveness and efficient use of taxpayer dollars through the use of performance measurement.
Appendix I: FY 2005 and PY 2004 Goals, Indicators, and Measures
Strategic Goal 1 — A Prepared Workforce: Enhance opportunities for America 's workforce
Outcome Goal 1.1 — Increase employment, earnings and retention
|
Performance Goal DOL-04-1.1A: Increase employment, retention and earnings of individuals registered under the Workforce Investment Act Adult Program (ETA) |
|
Indicators:
Baseline: 74% (PY 2003)
Baseline: 85% (PY 2003)
Baseline: $3,260
Baseline: NA |
Goals with changes in the wording or targets are identified by the endnote 1. New goals are identified by the endnote 2.
|
DOL-04 -1.1B: Improve the outcomes for job searchers and employers who receive public labor exchange services (ETA) |
|
Indicators:
Baseline: 61% (PY 2003 )
Baseline: 80% (PY 2003 )
Baseline: NA |
Goals with changes in the wording or targets are identified by the endnote 1. New goals are identified by the endnote 2.
|
DOL-04-1.1C: Increase the employment, retention, and earnings replacement of individuals registered under the Workforce Investment Act Dislocated Worker Program (ETA) 2 |
|
Indicators:
Baseline: 82% (PY 2003)
Baseline: 90% (PY 2003)
Baseline: 91% (PY 2003)
Baseline: NA |
Goals with changes in the wording or targets are identified by the endnote 1. New goals are identified by the endnote 2.
|
Performance Goal DOL-04-1.1D: Improve the employment outcomes for veterans who receive public labor exchange services and veterans' program services (VETS) |
|
Indicator: Veterans: Percent of Veteran job seekers employed in the first or second quarter following registration. Baseline: 58% (PY 2003) |
|
Indicator: Veterans: Percent of Veteran job seekers still employed two quarters after initial entry into employment with a new employer. Baseline: 79% (PY 2003)* |
|
Indicator: Disabled veterans: Percent of Disabled Veteran job seekers employed in the first or second quarter following registration. Baseline: 53% (PY 2003) |
|
Indicator: Disabled veterans: Percent of Disabled Veteran job seekers still employed two quarters after initial entry into employment with a new employer. Baseline: 77% (PY 2003)* |
|
Indicator: Homeless veterans (subpopulation): Entered employment rate for homeless veterans participating in the Homeless Veterans' Reintegration Program (HVRP) Baseline: 61% (PY 2003) |
|
Indicator: Homeless veterans: Employment retention rate after 6 months for homeless veteran HVRP participants. Baseline: TBD (PY 2004)** |
|
*PY 2003 results include only the first two quarters of retention data reported under the UI wage record based reporting system. **Baseline to be established on the basis of reported results for PY 2004. Efficiency Measures are under development for all other programs. |
Goals with changes in the wording or targets are identified by the endnote 1. New goals are identified by the endnote 2.
|
Performance Goal DOL-05-1.1A: Strengthen the registered apprenticeship program to meet the training needs of business and workers in the 21st century (ETA) |
|
Apprenticeship is moving to adopt measures consistent with the common measures, but using the Apprenticeship reporting system and not UI records at this time. Indicators:
Baseline: To be established in FY
2005
Baseline: To be established in FY
2005
Baseline: To be established in FY
2005 * Twenty-three states are federally-registered apprenticeship programs and enter data on individuals into the Registered Apprenticeship Information System (RAIS). A group of "tracked entrants" is defined as the cohort of apprentices registered and entered into RAIS during a given reporting period. ** This is an estimate which may be revised using FY 2005 baseline data. |
Goals with changes in the wording or targets are identified by the endnote 1. New goals are identified by the endnote 2.
|
Performance Goal DOL-05-1.1B: Provide national leadership to increase access and employment opportunities for youth and adults with disabilities receiving employment, training, and employment support services by developing and testing, and disseminating effective practices (ODEP) |
|
Indicators:
Baseline: |
Goals with changes in the wording or targets are identified by the endnote 1. New goals are identified by the endnote 2.
Outcome Goal 1.2 — Increase opportunities for youth employment
|
Performance Goal DOL-04-1.2A: Increase placements and educational attainments for youth served through the WIA youth program * (ETA) |
|
Indicators:
Baseline: 71% (PY 2003)
Baseline: 63% (PY 2003)
Baseline: 81% (PY 2003 )
Baseline: NA |
Goals with changes in the wording or targets are identified by the endnote 1. New goals are identified by the endnote 2.
|
Performance Goal DOL-04-1.2B: Improve educational achievements of Job Corps students, and increase participation of Job Corps graduates in employment and education * (ETA) |
|
Indicators:
Baseline: TBD
Baseline: TBD
Baseline: TBD
Baseline: TBD |
Goals with changes in the wording or targets are identified by the endnote 1. New goals are identified by the endnote 2.
|
Performance Goal DOL-05-1.3A: Improve information available to decision-makers on labor market conditions, and price and productivity changes (BLS) |
|||
|
Performance Measures |
Performance Targets |
||
|
Improve information available to decision-makers on labor market conditions, and price and productivity changes |
|||
|
'03 |
'04 |
'05 |
|
|
Improve relevancy |
|
|
|
|
Improve data relevance by reflecting changes in the economy, as measured by the number of series (e.g., Current Employment Statistics, Employment Cost Index, etc.) converted to the North American Industry Classification System (12 series in total) [2002 baseline = 1 series] |
4 |
8 |
9 |
|
Improve accuracy |
|
|
|
|
Coverage: |
|
|
|
|
Improve coverage by increasing the percent of domestic output of in-scope services included in the Producer Price Index (PPI) [1997 baseline = 38.8%] |
54.0% |
59.2% |
75.7% |
|
Improve coverage by increasing the percent of in-scope industries in the labor productivity measures [2000 baseline = 52.9%]1 |
60.9% |
58.0% |
58.3% |
|
Enhance information technology |
|
|
|
|
Lessen the likelihood of major systems failures that could affect the PPI's ability to release data on time, as measured by the percent of the components of the new repricing system completed [2002 baseline = 2%] |
10% |
17% |
40% |
|
Enhance efficiency and effectiveness |
|
|
|
|
Cost per transaction of the Internet Data Collection Facility (2004 baseline = $6.13) |
|
$6.13 |
$3.32 |
|
Raise customer satisfaction with BLS products and services (e.g., the American Customer Satisfaction Index) [2001 baseline = 74%]2 |
74% |
82% |
75% |
|
Deliver economic data on time (Percent of scheduled releases issued on time.) [2000 baseline = 99%] |
100% |
96% |
100% |
|
Percent of accuracy measures met (e.g., revision, response rates, etc.) [2000 baseline = 94%]3 |
98% |
83% |
100% |
Goals with changes in the wording or targets are identified by the endnote 1. New goals are identified by the endnote 2.
1In 2004, the percent of industries covered declined due to
changes in industry definitions as a result of the conversion to NAICS.
2In 2004, the BLS measured users' satisfaction with the
Occupational Outlook Handbook website.
3Beginning in
2005, response rates are no longer reflected in this aggregate measure.
Goal 2 — A Secure Workforce: Promote the economic security of workers and families
Outcome Goal 2.1 — Increase compliance with worker protection laws
|
Performance Goal DOL-05-2.1A: American workplaces legally employ and compensate workers (ESA) |
|
Indicators: Covered American workplaces legally, fairly, and safely employ and compensate their workers by:
Baseline: FY 2004 189 days
Baseline FY 2004: 71%
Establish baseline FY 2005
Baseline FY 2004: 1,491
Baseline FY 2002: 100% |
Goals with changes in the wording or targets are identified by the endnote 1. New goals are identified by the endnote 2.
|
Performance Goal 2.1B: Ensure union financial integrity, democracy, and transparency (ESA) |
|
Indicators:
Baseline FY 2004: 9%
Baseline: TBD in FY 2005
Baseline: TBD |
Goals with changes in the wording or targets are identified by the endnote 1. New goals are identified by the endnote 2.
Outcome Goal 2.2 — Protect worker benefits
|
Performance Goal DOL-05-2.2A: Make timely and accurate benefit payments to unemployed workers, and facilitate their reemployment (ETA) |
|
Indicators:
Baseline: FY 2001: 89.1%
Baseline: FY 2002: 57.9%
Baseline: FY 2002: 79.1% |
Goals with changes in the wording or targets are identified by the endnote 1. New goals are identified by the endnote 2.
|
Performance Goal DOL-05-2.2B: Minimize the impact of work related injuries (ESA) |
|
Indicators:
Baseline FY 2003: 147.6 days
Baseline FY 2003: 56 days
Baseline: NA
Baseline: Milliman
U.S.A. Health Costs Index
Target: Meet 60% of the following
targets:
Baseline FY 2003: 285 calendar
days
Baseline FY 2001: 66.5%
Baseline: 75%
Baseline: 75% Pay compensation benefits to 1200 claimants under Part E by the end of the Fiscal Year |
Goals with changes in the wording or targets are identified by the endnote 1. New goals are identified by the endnote 2.
|
Performance Goal DOL-05-2.2C: Secure pension, health and welfare benefits (EBSA) |
|
Indicator: Enhance Pension and Health Benefits Security Enforcement: Baseline FY 2002: 50% Achieve a 37.7% ratio of criminal cases referred for prosecution to total criminal cases Baseline FY 2002: 25% Participant Assistance: Baseline: FY 2003: 59 Achieve 8,340 additional applications to its Voluntary Compliance programs Baseline: (FY 2001-2003 average)
7,564 |
Goals with changes in the wording or targets are identified by the endnote 1. New goals are identified by the endnote 2.
|
Performance Goal DOL-05-2.2D: Improve service to pension plan customers (PBGC) |
|
Indicators:
Baseline FY 2002: 69
Baseline FY 2001: 73 |
Goals with changes in the wording or targets are identified by the endnote 1. New goals are identified by the endnote 2.
Goal 3 — Quality Workplaces: Foster Quality Workplaces that are safe, healthy and fair
Outcome Goal 3.1 — Reduce workplace injuries, illnesses, and fatalities
|
Performance Goal DOL-05-3.1A: Reduce work-related fatalities (OSHA/MSHA) |
|
Indicator: Reduce the rate of workplace fatalities by 6 percent in from baseline (for sectors covered by the Occupational Safety and Health Act) (OSHA) Baseline: 1.62 fatalities per
100,000 workers (FY2000-2002 average) |
|
Indicator: Reduce the mine industry fatal injury incidence rate by 15 percent from the baseline by the end of FY 2008. (MSHA ) Baseline FY 2003: .0229 fatalities
per 200,000 hours worked |
Goals with changes in the wording or targets are identified by the endnote 1. New goals are identified by the endnote 2.
|
Performance Goal DOL-05-3.1B: Reduce work-related injuries and illnesses (OSHA/MSHA) |
|
Indicator: FY 2005: Reduce the rate of workplace injuries and illness by 8 percent from baseline. (OSHA) Baseline: CY 2002 rate of 1.6 days
away from work cases per 100 workers (CY 2002). |
|
Indicator: Reduce the mine industry all-injury incidence rate by 50 percent from the baseline by the end of FY 2008. (MSHA) Baseline FY 2000: 5.07| In the mine industry, improve miner health by implementing the following Indicators: Indicators:
Baseline (FY 2003/2004) Coal dust:
10.7 Baselines: Baselines and targets are under revision because FY 2003 and FY2004 results greatly exceeded performance targets (previous targets were not challenging based in large part on the sampling approach utilized). As a result, MSHA is restructuring its health goal and sampling approach to better protect miner health. |
Goals with changes in the wording or targets are identified by the endnote 1. New goals are identified by the endnote 2.
Outcome Goal 3.2 — Foster equal opportunity workplaces
|
Performance Goal DOL-05-3.2A: Federal contractors achieve equal opportunity workplaces (ESA) |
|
Indicator: Reduce the incidence of discrimination among Federal contractors. Baseline FY 2001: 12.5% Targets are under review. |
|
Indicator: Increase compliance among Federal contractors in all other aspects of equal opportunity workplace standards. Baseline FY 2001: 57% * Targets are under review. |
Goals with changes in the wording or targets are identified by the endnote 1. New goals are identified by the endnote 2.
|
Performance Goal DOL-05-3.2B: Reduce employer-employee employment issues originating from service members' military obligations conflicting with their civilian employment (VETS) |
|
Indicators:
Baseline: 84% (FY 2004)
Baseline: 91% (FY 2004)
Baseline: 99% (FY 2004) |
Goals with changes in the wording or targets are identified by the endnote 1. New goals are identified by the endnote 2.
Outcome Goal 3.3 — Reduce exploitation of child labor, protect the basic rights of workers, and strengthen labor markets
|
Performance Goal DOL-05-3.3A: Contribute to the Elimination of the Worst Forms of Child Labor Internationally (ILAB)2 |
|
Indicators:
Baseline: 243,322
Baseline: 26
Baseline: 42,000
Baseline: 40%
Baseline: 40%
|
Goals with changes in the wording or targets are identified by the endnote 1. New goals are identified by the endnote 2.
|
Performance Goal DOL-05-3.3B: Improve living standards and conditions of work internationally (ILAB)2 |
|
Indicators:
Baseline: 62%
Baseline: To be established in FY
05/06
Baseline: 39 percent
Baseline: To be established by FY
02/05
Baseline: To be established by FY
02/05 |
Goals with changes in the wording or targets are identified by the endnote 1. New goals are identified by the endnote 2.
Goal 4 — A Competitive Workforce: Maintain competitiveness in the 21st Century economy
|
ETA Activities in Support of Outcome Goal 4.1 |
|
In Program Year 2006, many of ETA's programs are shifted to Goal 4. However, in PY 2004, ETA is undertaking several activities that directly support Goal 4, and while these activities are not Departmental goals, progress in these areas may be included in the FY 2005 Annual Performance and Accountability Report (APAR). Some of these activities are not line items in the budget but reflect DOL's commitment and progress in developing a competitive workforce, even as the larger programs transition into this goal in 2006. Some the activities that may be included in the narrative section of the FY 2005 APAR include:
|
Goals with changes in the wording or targets are identified by the endnote 1. New goals are identified by the endnote 2.
|
DOL-04 -4.1A: Build a demand-driven workforce system by increasing accessibility to workforce information (ETA) 2 |
|
Indicators:
Baseline: 12.5 million (PY 2003
)
Baseline: 169 million (PY 2003)
Baseline: 8 million (PY 2003) |
Goals with changes in the wording or targets are identified by the endnote 1. New goals are identified by the endnote 2.
|
Performance Goal DOL-0-4.1B: Increase the employment, retention and earnings replacement of workers dislocated in important part because of trade who receive trade adjustment assistance benefits (ETA)2 |
|
Indicators*:
Baseline: 65% (FY 2001)
Baseline: 90% (FY 2001)
Baseline: 85% (FY 2001)
Baseline: NA * Entered employment, retention, and earnings replacement reflect current measurement and not the common measures definition. |
Goals with changes in the wording or targets are identified by the endnote 1. New goals are identified by the endnote 2.
|
Performance Goal DOL-05-4.1A: Address worker shortages through the Foreign Labor Certification Program (ETA) |
|
Indicators:
Baseline: 99%
Baseline: Collect baseline data in
FY 2005
Baseline: Collect baseline data in
FY 2005
Baseline: 70% |
Goals with changes in the wording or targets are identified by the endnote 1. New goals are identified by the endnote 2.
Outcome Goal 4.2 — Promote job flexibility and minimize regulatory burden
|
Performance Goal DOL-05-4.2A: Maximize regulatory flexibility and benefits and promote flexible workplace programs (ASP) |
|
Indicator: Wage and hour, worker safety, pension and health care regulations, to the greatest extent practicable, are performance-based and provide maximum flexibility to employers in developing a compliance approach.
Target: Initiate rulemaking for revisions as appropriate
Indicator: New and current regulations maximize net benefits. Regulations that impose greater societal costs than benefits are revised or eliminated, consistent with applicable governing statutes.
Target: Initiate rulemaking as appropriate Indicator: DOL ensures compliance with its regulations in the most cost-effective manner. Non-cost-effective practices are modified or eliminated, consistent with governing statutes. (DOL Agencies)
Target: Reduce unit cost per enforcement action by X% Indicator: Best practices for, and models of, flexible workplace practices are identified and publicized Baseline FY 2004: Develop best
practices studies Indicator: Increase the percent of small employers with access to health care benefit plans * Baseline: CY 2004 * Consistent with and contingent upon the passage of Association Health Plan legislation now pending before Congress. |
Goals with changes in the wording or targets are identified by the endnote 1. New goals are identified by the endnote 2.
This Appendix shows the Department of Labor Program Year 2005 goals. These goals cover the period from July 1, 2005 — June 30, 2006, and will be reported in the FY 2006 Annual Performance and Accountability Report.
|
Performance Goal DOL-05-1.1A: Increase employment, retention and earnings of individuals registered under the Workforce Investment Act Adult Program (ETA) |
|
Indicators:
Baseline: 76% (PY 2003)
Baseline: 86% (PY 2003)
Baseline: $3,260 (PY 2003)
Baseline: Note: while targets have been established for prior measures, PY 2005 is also the baseline year for the common measures. |
Goals with changes in the wording or targets are identified by the endnote 1. New goals are identified by the endnote 2.
|
Performance Goal DOL-05-1.1B: Improve the outcomes for job searchers and employers who receive public labor exchange services (ETA) |
|
Indicators:
Baseline: 61% (PY 2003)
Baseline: 80% (PY 2003)
Target: $46 Note: while targets have been established for prior measures, PY 2005 is also the baseline year for the common measures. |
Goals with changes in the wording or targets are identified by the endnote 1. New goals are identified by the endnote 2.
|
Performance Goal DOL-05-1.1C: Increase the employment, retention, and earnings replacement of individuals registered under the Workforce Investment Act Dislocated Worker Program (ETA)2 |
|
Indicators:
Baseline: TBD
Baseline: TBD
Baseline: TBD
Note: while targets have been established for prior measures, PY 2005 is also the baseline year for the common measures. |
Goals with changes in the wording or targets are identified by the endnote 1. New goals are identified by the endnote 2.
|
Performance Goal DOL-05-1.1D: Improve the employment outcomes for veterans who receive One Stop Career Center services and veterans' program services (VETS) |
|
Indicators:
Baseline: 58% (PY 2003)
Baseline: 79% (PY 2003)*
Baseline: 53% (PY 2003)
Baseline: 77% (PY 2003
estimate)
Baseline: 61% (PY 2003)
Baseline: TBD (PY 2004)**
Baseline: TBD (PY 2004)** *PY 2003 results include only the first two quarters of data reported on retention. ** Baseline to be established on the basis of reported results for PY 2004. Efficiency Measures are under development for all other programs |
Goals with changes in the wording or targets are identified by the endnote 1. New goals are identified by the endnote 2.
|
Performance Goal DOL-05-1.2A: Increase placements and educational attainments for youth served through the WIA youth program (ETA) |
|
Indicators:
Target: 69%
Target: 53%
Target: 80%
Baseline: TBD Note: While targets have been established, PY 2005 is also the baseline year for two of the youth common measures. |
Goals with changes in the wording or targets are identified by the endnote 1. New goals are identified by the endnote 2.
|
Performance Goal DOL-05-1.2B: Improve educational achievements of Job Corps students, and increase participation of Job Corps graduates in employment and education (ETA) |
|
Indicators:
Baseline: TBD
Baseline: TBD
Baseline: TBD
Baseline: TBD |
|
DOL Performance Goal DOL-05-4.1A: Build a Demand Driven Workforce |
|
The Community College Initiative/Community Based Job Training Grants will be funded for the first time in PY 2005, as authorized and appropriated through the FY 2005 Omnibus Appropriations Act. ETA intends to develop information collection systems to address the common measures below: Indicators:
Targets: Since the grants will be new in PY 2005, data for these indicators is not expected to be adequate for establishing a baseline. Baseline data will be collected in PY2006-PY2007 |
Goals with changes in the wording or targets are identified by the endnote 1. New goals are identified by the endnote 2.
|
DOL-05-4.1B: Build a demand-driven workforce system by increasing accessibility to workforce information (ETA) 2 |
|
Indicators:
Baseline: 12.5 million (PY 2003)
Baseline: 169 million (PY 2003)
Baseline: 8 million (PY 2003)
Target: Baseline to be established |
Goals with changes in the wording or targets are identified by the endnote 1. New goals are identified by the endnote 2.
| |
||||