The
number of elementary school-age children (ages 5 through 13) declined
by 381,000 while the number of their high school-age counterparts (ages
14 through 17) increased by 329,000 between 2003 and 2004, according to
estimates released today by the U.S. Census Bureau. Arizona had the largest
numerical increase of children between the ages of 5 and 13, and California
had the largest numerical increase of those between ages 14 and 17.
Both the number of adults in the 18 and
older and 65 and older categories also showed increases nationally over
the period, led by Texas and California, respectively. 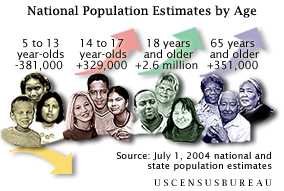
These July 1, 2004, state population estimates
are available by a variety of specific age groups. Highlights follow:
Elementary School-Age Children
(ages 5 through 13)
- California had the highest total of elementary school-age children
(4.8 million) in 2004, followed by Texas (3.1 million), New York (2.3
million), Florida (2.0 million) and Illinois (1.6 million). Nationally,
there were 36.4 million children in this age group.
- Only six states experienced an increase in their elementary school-age
population between 2003 and 2004. Arizona (8,400), Nevada (7,500) and
Florida (7,100) led the way, with North Carolina, Colorado and Georgia
rounding out the list.
- Nevada, at 2.5 percent, led the nation in the rate of increase in
the elementary school-age population from 2003 to 2004. Arizona (1.1
percent) followed. Nationally, the number of children of these ages
declined by 1.0 percent.
- Utah had the highest proportion of its total population in this age
group in 2004 (14.9 percent), followed by Alaska (14.1 percent).
- Puerto Rico’s elementary school-age population declined by
0.8 percent between 2003 and 2004.
High School-Age Children (ages
14 through 17)
- California had the highest number of high school-age children (2.1
million) in 2004, followed by Texas (1.4 million), New York (1.1 million),
Florida (933,000), Illinois (728,000) and Pennsylvania (701,000). The
total nationally was 16.8 million.
- More than two-thirds of the states experienced an increase in their
high school-age population between 2003 and 2004, led by California
(78,000), Florida (33,000) and New York (24,000).
- Nevada saw its high school-age population climb by a nation-leading
6.2 percent from 2003 to 2004. It was followed by the District of Columbia
(5.2 percent). Nationally, this age group experienced a 2.0 percent
increase in its population.
- Puerto Rico’s population, ages 14 to 17, declined 0.4 percent
between 2003 and 2004.
Adult Population (age 18 and older)
- California had the highest number of adult residents (26.3 million)
in 2004, followed by Texas (16.2 million), New York (14.7 million),
Florida (13.4 million), Pennsylvania (9.6 million) and Illinois (9.5
million).
- Texas added the highest number of adult residents since 2003 (330,000),
followed by Florida (324,000) and California (308,000). Nationally,
the adult population rose by 2.6 million.
- Puerto Rico’s adult population increased by 31,000 between 2003
and 2004.
Older Population (age 65 and older)
- California had the highest number of people 65 and older (3.8 million)
in 2004, followed by Florida (2.9 million), New York (2.5 million),
Texas (2.2 million), Pennsylvania (1.9 million), Ohio (1.5 million)
and Illinois (1.5 million).
- California added the highest number of people 65 and older (57,000)
between 2003 and 2004, followed by Texas (37,000) and Florida (32,000).
Nationally, this age group showed an increase of 351,000 people.
- Nevada (4.2 percent) and Alaska (3.8 percent) experienced the highest
rate of increase in people 65 and older from 2003 to 2004.
- Florida had the highest proportions of its total population in the
65 and older age group (16.8 percent), followed by West Virginia and
Pennsylvania (15.3 percent each) and North Dakota and Iowa (14.7 percent
each).
- The number of people age 65 and older in Puerto Rico increased by
2.9 percent from 2003 to 2004.
- X -
The Census Bureau develops state population estimates
using administrative records in “a demographic-change model.”
The method follows each birth cohort according to its exposure to mortality,
fertility and migration. It estimates population change from the most
recent census using data on births, deaths and migration.
|