

RELEASED: 12:01 A.M. EDT, THURSDAY, MARCH 27, 2008
- Robert Bernstein
- Public Information Office
- 301-763-3030/763-3762 (fax)
- 301-457-1037 (TDD)
- e-mail: <pio@census.gov>
- CB08-49
- Broadcast Release [PDF]
- Detailed tables
- State Contacts
- Graphic 1 [JPG] | Graphic 2 [JPG]
New Orleans Among the 10 with Fastest Growth Rate
Dallas-Fort Worth Leads Metro Areas in Numerical Growth
Dallas-Fort Worth had the largest numeric gain of any metro area between 2006 and 2007, increasing by 162,250, according to July 1, 2007, estimates of metro area population size and growth released today by the U.S. Census Bureau. Atlanta (151,063), Phoenix (132,513) and Houston (120,544) rounded out the metro areas with a gain of at least 100,000.
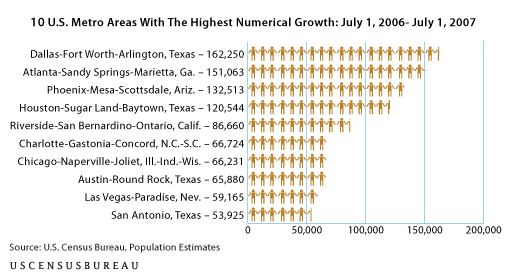
The Midwest metro area with the greatest numeric change between July 1, 2006, and July 1, 2007, was Chicago (seventh overall nationally), while the Northeast metro area with the greatest numeric change over the same period was New York (21st overall nationally). (See Table 1 [Excel].)
Eight of the 10 fastest-growing metro areas between 2006 and 2007 were located in the South. (See Table 2 [Excel].)
Four of these fast-growing Southern metro areas were not only among the top 10 in percent growth from 2006 to 2007 but also among the 20 largest numeric gainers during the same period. Raleigh, N.C., was the third fastest-growing metro area, 4.7 percent, as well as the 12th largest numeric gainer, at 47,052. Austin, Texas, was the fifth fastest-growing metro area, 4.3 percent, as well as the eighth largest numeric gainer, at 65,880. Charlotte, N.C.-S.C., was the seventh fastest-growing metro area, 4.2 percent, as well as the sixth-largest numeric gainer, at 66,724. (See Tables 1 [Excel] and 2 [Excel].)
The fourth metro area in the South, New Orleans, was the eighth-fastest growing metro area between July 1, 2006, and July 1, 2007, as its population climbed 4 percent. It also was the 16th largest numeric gainer over the same period, with an increase of 39,885. The metro area previously had the highest rate of decline between July 1, 2005, and July 1, 2006.
In addition to New Orleans, other Gulf Coast metro areas where populations increased between 2006 and 2007 after having experienced 2005-2006 population declines included Gulfport-Biloxi, Miss. (1.8 percent population growth from 2006 to 2007); Pascagoula, Miss., (1.6 percent); Beaumont-Port Arthur, Texas (0.5 percent); and Lake Charles, La. (0.4 percent).
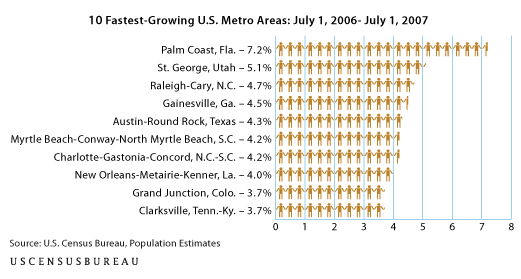
The 50 fastest-growing metro areas were concentrated in two regions — 27 in the South and 20 in the West. One metro area, Fayetteville, Ark.-Mo., straddled both the South and Midwest regions. Sioux Falls, S.D., and Springfield, Mo., were the two metro areas among the 50 fastest-growing located completely in the Midwest. None of the 50 was in the Northeast. That region’s fastest-growing metro area was York, Pa., which ranked 107th.
New York was the most populous metro area on July 1, 2007, with 18.8 million people, followed by Los Angeles (12.9 million) and Chicago (9.5 million). Nine metro areas had 2007 populations of 5 million or more. (See Table 3.)
More than four-fifths of all U.S. metro areas (303 out of 363) had a larger population on July 1, 2007, than on July 1, 2006. The 50 fastest-growing metro areas grew by at least 2.3 percent during this period, which is more than double the nation’s total population gain of 1 percent. As of July 1, 2007, the 363 metro areas in the United States contained 251.9 million people — 83.5 percent of the nation’s population.
-X-
The Census Bureau is releasing population estimates of metro and micro areas — comprising one or more counties and collectively known as core-based statistical areas (CBSAs). All geographic boundaries for the July 1, 2007, population estimates series are defined as of Jan. 1, 2007. The Office of Management and Budget’s statistical area definitions (for metropolitan, micropolitan, and combined statistical areas, as well as metropolitan divisions) are those issued by that agency in December 2006. Some metro area titles are abbreviated in the text of the news release. Full titles are shown in the tables.
[Excel] or the letters [xls] indicate a document is in the Microsoft® Excel® Spreadsheet Format (XLS). To view the file, you will need the Microsoft® Excel® ViewerThis symbol