

FOR IMMEDIATE RELEASE
WEDNESDAY, JUNE 13, 2007
- Public Information Office
- 301-763-3691/763-3762 (fax)
- 301-457-1037 (TDD)
- e-mail: <pio@census.gov>
- CB07-CN.06
- Press kit
- ACS Media Toolkit
- 2005 Data User’s Guide
- Detailed Tables [Excel]
- Graphic
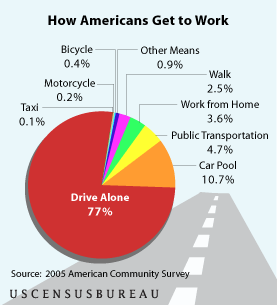
Most of Us Still Drive to Work – Alone
Public Transportation Commuters Concentrated in a
Handful of Large Cities
 Despite
rising fuel costs, commuters continued to drive their cars in 2005, according
to a new U.S. Census Bureau analysis of data from the American Community Survey.
The survey, gathered over the course of the year, found that driving to work
was the favored means of commute of nearly nine out of 10 workers (87.7 percent),
with most people (77 percent) driving alone.
Despite
rising fuel costs, commuters continued to drive their cars in 2005, according
to a new U.S. Census Bureau analysis of data from the American Community Survey.
The survey, gathered over the course of the year, found that driving to work
was the favored means of commute of nearly nine out of 10 workers (87.7 percent),
with most people (77 percent) driving alone.
In contrast, 4.7 percent of commuters used public transportation to travel to work in 2005, an increase of about 0.1 percent over 2000 levels.
About half of the nation’s public transportation commuters can be found in 10 of the nation’s 50 cities with the most workers age 16 or over: Baltimore, Boston, Chicago, Houston, Los Angeles, New York, Philadelphia, San Francisco, Seattle and Washington, D.C. These cities account for 2.9 million of the nation’s 6.2 million users of public transportation (see detailed tables).
Beyond the total number of public transportation users, these cities also had relatively high rates of public transportation use. However, Los Angeles and Houston, with rates of 10.3 percent and 5.1 percent, respectively, had lower rates than many other smaller cities, including Minneapolis (12.5 percent); Oakland, Calif. (16.5 percent); Portland, Ore. (13.3 percent) and Seattle (17 percent).
“This is a prime example of the value
of an ongoing survey such as the American Community Survey,” said Census
Bureau Director Louis Kincannon. “With each succeeding year, we’ll
be able to see how people respond to changing circumstances, such as rising
gas prices.”
The public transportation data are among the
many topics that can be localized from the American Community Survey. Some
other commuter facts of interest include:
- Approximately one in 10 of us (10.7 percent) car pool to work. About three-fourths
of car poolers (77.3 percent) ride with just one other person. Large cities
with some of the highest rates of car pooling include Fresno, Calif. (15.1
percent); Honolulu (15.6 percent); Mesa, Ariz. (16.7 percent); Phoenix (16.2
percent); and Sacramento, Calif., (15.7 percent).
- Portland, Ore., has the distinction among large cities as having the highest
percentage of bicycle commuters. Approximately 3.5 percent of Portland’s
workers pedal to work, about eight times the national average of 0.4 percent.
- The third most popular option was no commute at all. Approximately 3.6
percent of us worked from home in 2005. Large cities with high rates of
home-based workers included Austin, Texas (5 percent); Colorado Springs,
Colo. (4.9 percent); Portland, Ore. (5.3 percent); San Francisco (6.3 percent);
and Seattle (5.1 percent).
- Boston had the highest percentage among large cities of employees who walk to work (13 percent). Nationally, 2.5 percent of us walked to work, the fourth most popular mode of transportation behind driving and using public transportation.
As part of the Census Bureau’s reengineered 2010 Census, the data collected by the ACS helps federal officials determine where to distribute more than $300 million to state and local governments each year. Responses to the survey are strictly confidential and protected by law.
The 2005 ACS estimates are based on an annual, nationwide household sample of about 250,000 addresses per month. Geographic areas for which data are available are based on total populations of 65,000 or more. The ACS estimates released are for the household population and do not include populations residing in group quarters.
As is the case with all surveys, statistics from sample surveys are subject to sampling and nonsampling error. Estimates for states (or counties, cities, regions, etc.) in the same paragraph in this news release may not be significantly different from one another. Please consult the data tables for specific margins of error. For more information go to http://www.census.gov/acs/www/UseData/index.htm.