

FOR IMMEDIATE RELEASE
WEDNESDAY, MARCH 30, 2005
- Stephen Buckner/Joanna Gonzalez
- Public Information Office
- (301) 763-3691/457-3620 (fax)
- (301) 457-1037 (TDD)
- e-mail: <pio@census.gov>
Americans Spend More Than 100 Hours Commuting to
Work Each Year, Census Bureau Reports
Americans spend more than 100 hours commuting to work each year, according to American Community Survey (ACS) data released today by the U.S. Census Bureau. This exceeds the two weeks of vacation time (80 hours) frequently taken by workers over the course of a year. For the nation as a whole, the average daily commute to work lasted about 24.3 minutes in 2003.
“This annual information on commuters
and their work trips and other transportation-related data will help local,
regional and state agencies maintain, improve, plan and develop the nation’s
transportation systems,” said Census Bureau Director Louis Kincannon.
“American Community Survey data will provide valuable assistance
to agencies offering housing, education and other public services as well.”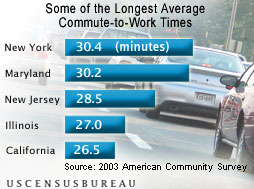
Based on a ranking of states with the longest average commute-to-work times, the ACS showed that New York (30.4 minutes) and Maryland (30.2 minutes) residents spent the most time traveling to their jobs. New Jersey (28.5 minutes), Illinois (27.0 minutes) and California (26.5 minutes) were also among states with some of the longest one-way commute times. States with some of the lowest average commute times included South Dakota (15.2 minutes), North Dakota (15.4 minutes), Nebraska (16.5 minutes) and Montana (16.9 minutes). (See state rankings [PDF].)
Of the 231 counties with populations of 250,000 or more covered by the ACS, Queens (41.7 minutes), Richmond (41.3 minutes), Bronx (40.8 minutes) and Kings (39.7 minutes) – four of the five counties that comprise New York City – experienced the longest average commute-to-work times. Additionally, workers living in Prince William County, Va. (36.4 minutes); and Prince George’s County, Md. (35.5 minutes); – suburban counties located within the Washington, D.C. metro area – also faced some of the longest commutes. (See county rankings [PDF].)
In a ranking of large cities (with populations of 250,000 or more), New York (38.3 minutes); Chicago (33.2 minutes); Newark, N.J. (31.5 minutes); Riverside, Calif. (31.2 minutes); Philadelphia (29.4 minutes); and Los Angeles (29.0 minutes) had among the nation’s highest average commute times. Among the 10 cities with the highest average commuting times, New York and Baltimore lay claim to having the highest percentage of people with “extreme” commutes; 5.6 percent of their commuters spent 90 or more minutes getting to work. People with extreme commutes were also heavily concentrated in Newark, N.J. (5.2 percent); Riverside, Calif. (5.0 percent); Los Angeles (3.0 percent); Philadelphia (2.9 percent); and Chicago (2.5 percent). Nationally, just 2.0 percent of workers faced extreme commutes to their jobs. (See extreme commutes rankings [PDF].)
In contrast, workers in several cities are fortunate enough to experience relatively short commute times, including Corpus Christi, Texas (16.1 minutes); Wichita, Kan. (16.3 minutes); Tulsa, Okla. (17.1 minutes); and Omaha, Neb. (17.3 minutes). (See city rankings [PDF].)
Other highlights:
- Chicago; Riverside, Calif.; and Los Angeles were the only cities among those with the highest average travel times to work that are not located on the East Coast.
- Among the 10 counties with the highest average commuting times, the highest percentages of extreme commuters were found in the New York City metro area: Richmond, N.Y. (11.8 percent); Orange, N.Y. (10.0 percent); Queens, N.Y. (7.1 percent); Bronx, N.Y. (6.9 percent); Nassau, N.Y., (6.6 percent); and Kings, N.Y. (5.0).
- Among the 10 states with the highest average commuting times, the highest percentages of their workers commuting 90 or more minutes to their job were found in New York (4.3 percent), New Jersey (4.0 percent) and Maryland (3.2 percent).
The new ACS is the cornerstone of the government’s effort to keep pace with the country’s ever-increasing demands for timely and relevant population and housing data. Being mailed to about 250,000 (roughly 1-in-480) addresses a month nationwide, the ACS will provide current demographic, housing, social and economic information about America’s communities every year — information previously available only once every 10 years.
The American Community Survey data are based on responses from
a sample of households across the nation. The estimates and rankings may
vary from the actual values because of sampling or nonsampling variations.
The statistical statements have undergone testing, and comparisons are
significant at the 90-percent confidence level. Additional information
and data profiles for the nation, states, counties and places may be accessed
at
<http://www.census.gov/acs> or <http://factfinder.census.gov>.