|
In the Census Bureau’s web site you can link to State & County QuickFacts, http://quickfacts.census.gov/qfd/ which has business information at the national, state and county level. The State & County QuickFacts’ web site has facts about people, business, and geography. Once you select State & County QuickFacts, a map gives you the option of selecting a State or “View more USA QuickFacts”: 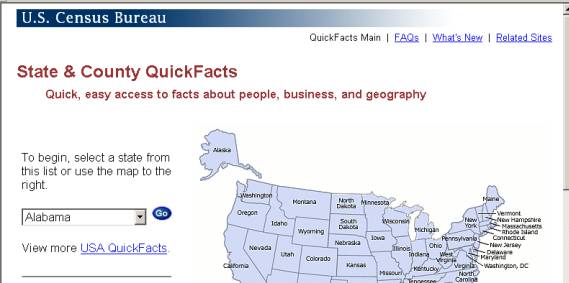
For example, let’s take a look at the entire country by selecting “View more USA QuickFacts”, which generates a listing of People, Business and Geography QuickFacts: 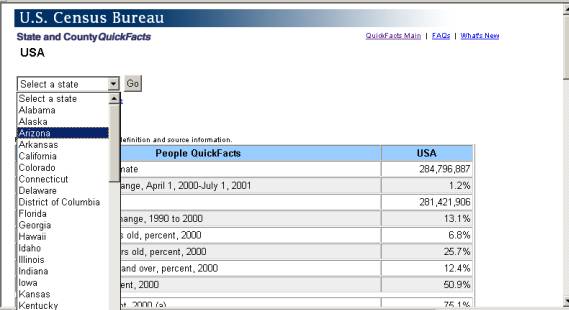
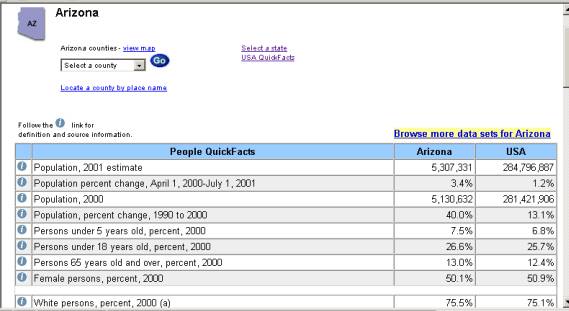
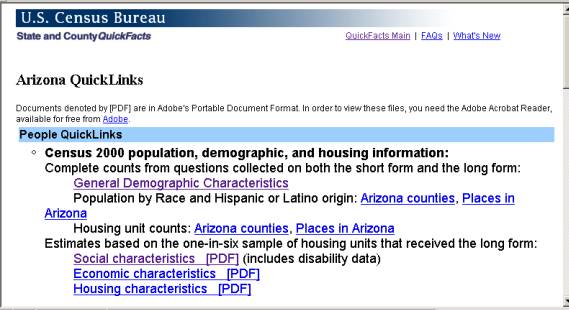
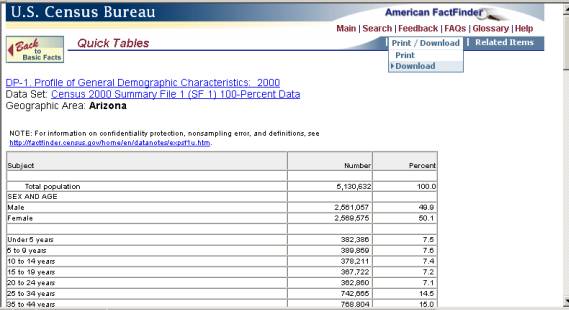
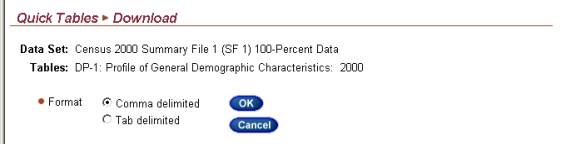
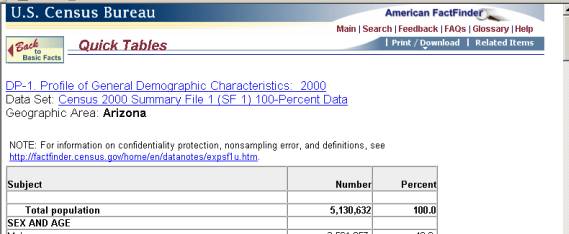
Now we select Arizona. We see the same listing of People, Business and Geography QuickFacts but for the state of Arizona with the only difference that we can “Browse more data sets”: Once we click on “Browse more data sets for Arizona” we get all the datasets available for People, Business and Geography for the state: If we want to create an Excel file of the “General Demographic Characteristics” in Arizona, we open that table, which gives us the opportunity to download it by moving the pointer over the “Print/Download” menu and clicking “Download”: We then select the Comma delimited format and click “OK” to download the table to our computer.
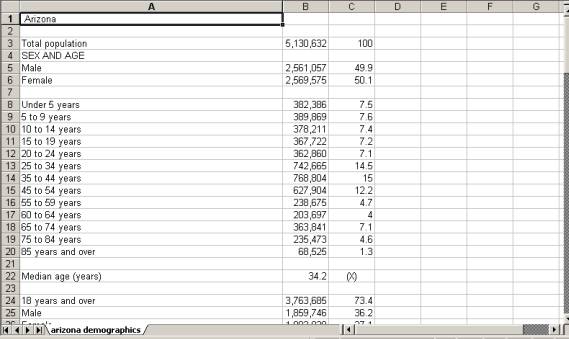
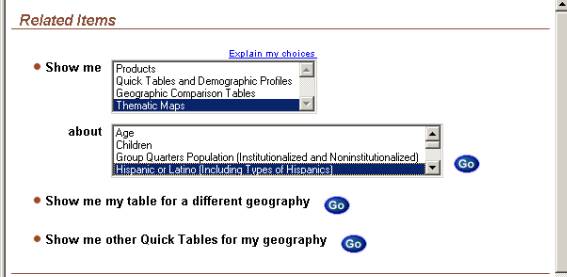
Once we save the table (“arizona demographics.csv”) we can open it as an Excel file. This file will contain all the items tied to the “General Demographic Characteristics” for the State of Arizona, including total population, sex and age, race, Hispanic or Latino and race, and housing occupancy. From this site, we can also create a thematic map. For example, if we want to show where the largest numbers of Hispanics are in Arizona, we go to “Related Items”:
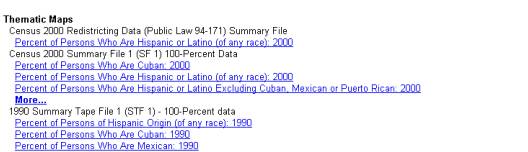
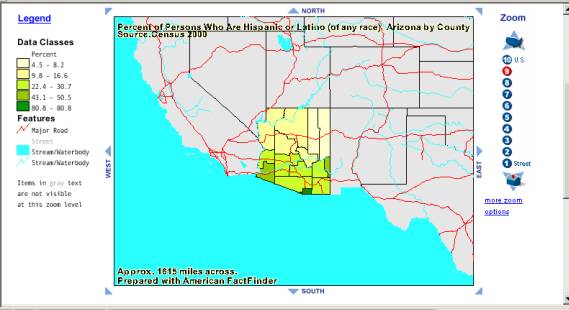
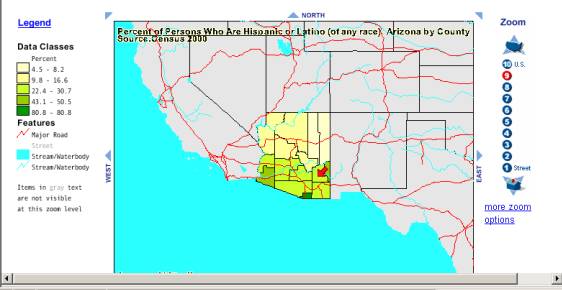
Open “Show me” and “Thematic Maps” about “Hispanic or Latino (Including Types of Hispanics)” and then click “Go”: Various Thematic Maps are listed. We select the first one:
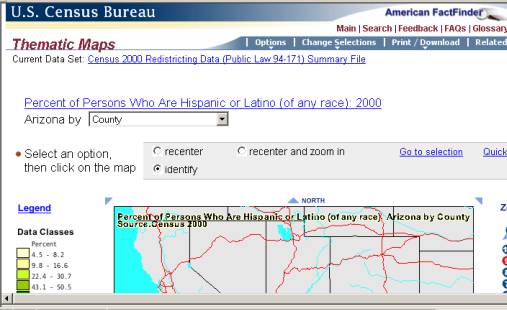
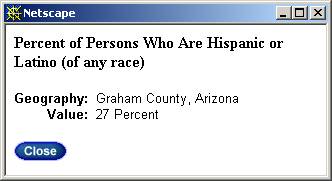
We can identify the areas by selecting “Identify”; next, we place the cursor on top of the area and click:
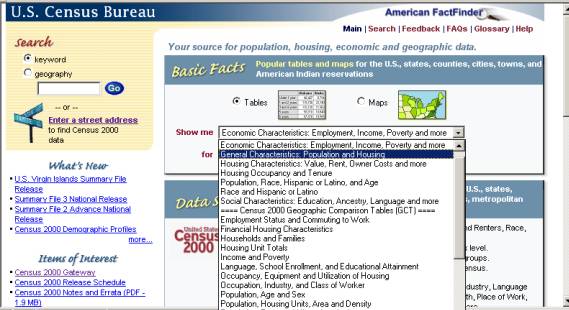
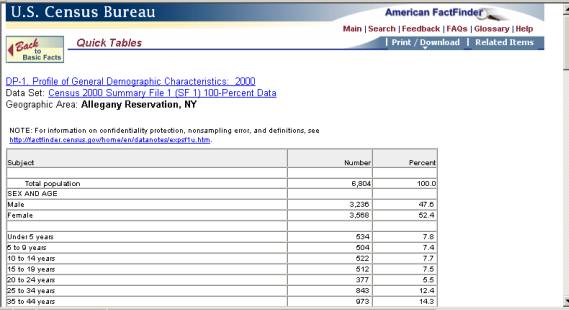
Another tool available in the Census Bureau’s web site is American FactFinder, which allows you to build a table to your specifications. The American FactFinder web site allows users to built the tables to fit their specific needs. It contains population, housing, economic, and geographic data. Its Thematic Maps plot statistical data to illustrate facts about specific areas by using colors or patterns.
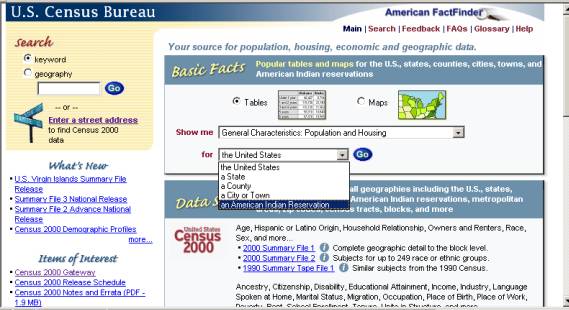
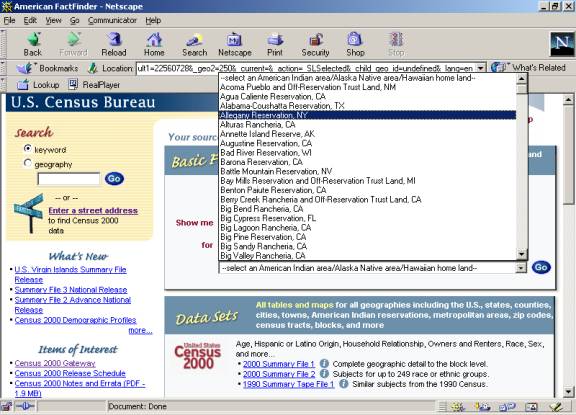
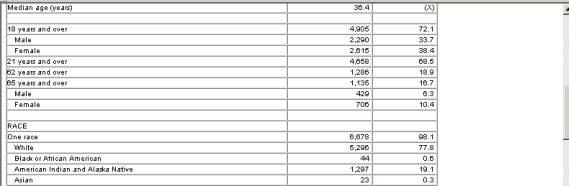
In this case, we want information about the population in the Allegany Reservation in NY. We first open “Show me” and choose “General Characteristics: Population and Housing”: Next, we choose “American Indian Reservation”: And finally we select the “Allegany Reservation, NY” and click “Go”: The table we built contains data about total population by age and gender; race breakdown; Hispanic or Latino data; household information and housing occupancy and tenure: Help with statistics is available via telephone, e-mail, or mail:
|