|
|
|
||||||||||||||||||||||||||||||||||||||||||||||||||||||||||||||||||||||||||||||||||||||||||||
|
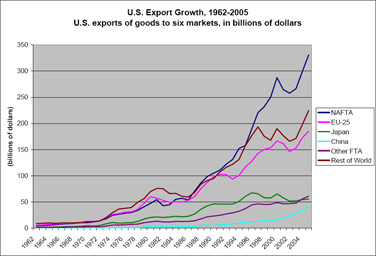
NAFTA Partners Lead Strong U.S. Export Growth
Free trade means more trade for the United States. That is a key conclusion drawn from an analysis by the International Trade Administration. The past three years have been marked by significant, steep increases in U.S. exports to its key trading partners, particularly those countries with which it enjoys low trade barriers, according to an analysis of trade figures conducted by the International Trade Administration. The analysis uses the Commerce Department’s Trade Policy Information System (TPIS), which draws on data from the Census Bureau, the United Nations, the World Bank, and the International Monetary Fund to track international trade. Of the 25 largest export markets for U.S. goods, 23 of them showed increases in 2005. (See table at end of story.) Overall, U.S. exports of goods grew by more than $86 billion in 2005 and are poised for significant growth in 2006. NAFTA Partners at the Forefront The export trend is particularly evident in the numbers for U.S. trade with its two largest trading partners, Canada and Mexico. (See chart below.) These two countries are partners with the United States in the North American Free Trade Agreement (NAFTA). NAFTA is the United States’ largest free trade agreement and one of the world’s largest free trade areas. Since implementation of NAFTA in 1994, U.S. shipments to Mexico and Canada have more than doubled. This trend is continuing in 2006, with exports to Canada growing 10.2 percent and those to Mexico growing 15.1 percent through the end of May compared with the same period last year. (Story continues below.)
Importance of Emerging Markets Among the fastest growing U.S. markets are the emerging economies of China and India. These rising economic powers have populations of more than a billion people each, with a growing middle class of a hundred million or more. Consumers in these countries seek many of the products the United States makes, from basic food products to high technology and the services that support them. U.S. exports to China grew by 20.5 percent from 2004 to 2005 and are continuing to grow rapidly, with an increase of 36.5 percent during the first five months of this year, compared to 2005. Exports to India are growing at a similarly rapid pace, rising 23.5 percent over the same period in 2006, after climbing 30.6 percent last year. New FTAs Lead the Way Perhaps the most interesting trend identified by these trade figures is the impact that free trade agreements (FTAs) are having on trade flows between the United States and other, non-NAFTA, FTA countries. Of the world’s total gross domestic product (excluding the United States) in 2005, some 6.8 percent was accounted for by the United States’ free trade partners. Yet these same FTA countries represented a much greater share—42.4 percent—of U.S. exports. Included among this latter group of FTA countries are some of our newest FTA partners, such as Chile and Australia. Since the implementation of a free trade agreement with Chile in 2004, exports have nearly doubled. For Australia, an already developed economy with a mature relationship with the U.S., exports have increased by more than 10 percent since implementation of the FTA in January 2005. Today, another half dozen countries—Colombia, Malaysia, Panama, Peru, South Korea, and Thailand—are in various stages of negotiating or ratifying a free trade agreement with the United States. They all represent growth opportunities for U.S. exports. Just one of them, the South Korea FTA, will be the largest FTA with the United States since NAFTA.
(Story continues below.)
The Commerce Department’s International Trade Administration offers current and historical trade data, as well as trade analysis, on its Web site. To find out more about U.S. strategy to increase exports and how U.S. businesses can be a part of that success, visit the federal government’s export portal, www.export.gov. |
|
|||||||||||||||||||||||||||||||||||||||||||||||||||||||||||||||||||||||||||||||||||||||||||