The USDOT Urban Partners & FHWA
Download the PowerPoint
Presentation (PPT, 1.7MB)
To view Power Point files, you can use the Microsoft
PowerPoint Viewer.
Slide 1
The USDOT Urban Partners & FHWA
August 20, 2007
Webcast with Division Offices
Jeffrey F. Paniati
Associate Administrator, Office of Operations
Federal Highway Administration
U.S. Department of Transportation
Slide 2
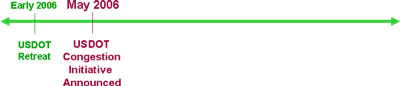
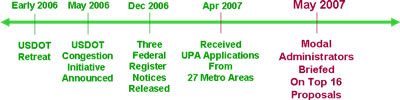
Path to the Urban Partners
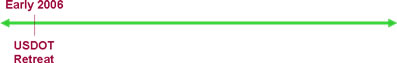
- Retreat for USDOT leadership
- Congestion identified as the Issue that should be addressed
- Initiated major Departmental effort to scope out a plan
Slide 3
Path to the Urban Partners
- Six Points
- Cornerstone - Relieve Urban Congestion (Congestion Pricing)
Slide 4
Congestion Pricing - Bringing Supply and Demand into Alignment
- Failure to properly price travel on highways is a root cause of congestion
- The price of highway travel (gas taxes, registration fees, etc.) bears little or no relationship to the cost of congestion
- Unlike other public utilities, the public expectation is that the "service" is free or does not change with changes in demand
- Allocating transportation services via pricing is more efficient than allocating by delay
Slide 5
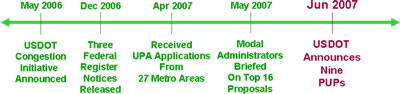
Path to the Urban Partners
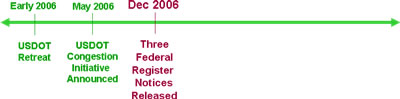
- Three Notices
- Urban Partnership Agreements
- Value Pricing Pilot Program
- ITS Operational Testing to Mitigate Congestion
- $130 Million Available (Eventually grew to over $1 Billion)
Slide 6
Urban Partnership Agreements - Congestion Pricing
- Integrated "4T" Strategy
- TOLLING (pricing) - Key Element
- Direct user charge based on use of facility; varies based on level of congestion
- Toll collection via electronic means (no booths)
- Transit
- Telecommuting/Travel Demand Management
- Technology
- TOLLING (pricing) - Key Element
Slide 7
Path to the Urban Partners
- Over half included a pricing component
- Most included transit features
- Most had a technology component
- Relatively few major telecommuting proposals
Slide 8
Path to the Urban Partners
- Extensive inter-departmental review
- UPA Coordination Team
- Technical Review Teams
- Involved consensus-building in context of OST defined over-arching objectives
Slide 9
Path to the Urban Partners
- Seattle, San Francisco, Minneapolis-St. Paul, New York City, Miami
- San Diego, Denver, Dallas, Atlanta
Slide 10
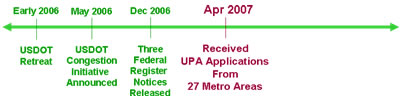
Path to the Urban Partners
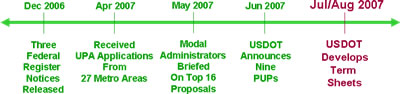
- Multi-modal effort to identify projects and sources of funds
- Discussions with potential Urban Partners
- Develop final list based on requirements and available funds
- Non-binding agreements with Urban Partners
Slide 11
Path to the Urban Partners
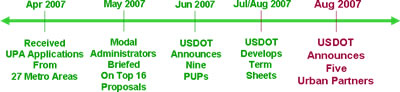
- Seattle, San Francisco, Minneapolis-St. Paul, New York City, Miami
- San Diego funded for SWOOP, but not a Urban Partner
- $850 Million of discretionary resources committed
Slide 12
New York
- $354 million IF cordon/area pricing is implemented in Manhattan by March 31, 2009
- Will charge drivers $8 and trucks $21 a day to enter or leave Manhattan below 86th Street on weekdays during the workday
- Those who drive only within the congestion zone would pay $4 a day for cars, $5.50 for trucks
- Final plan yet to be determined; must meet specified performance measure (6.3% reduction in the pricing zone)
- $1.6 million to cover up-front planning costs
- Tolling authority required by March 2008 to receive remainder of funds
- Significant because this is the first time cordon/area pricing will be implemented in the US
Slide 13
New York
- Project Highlights - $354 Million Total
- Implementation of area Pricing
- Bus Facilities and Other Improvements
- Initiation of Bus Rapid Transit
- Regional Ferry Services
- West of Hudson Regional Transportation Alternative Analysis
Slide 14
New York
- Partners
- New York City Department of Transportation
- New York Metropolitan Transportation Authority
- New York State Department of Transportation
Slide 15
New York
- Sources of Funds - $354.0 million
- FHWA - $20.8 million
- Value Pricing Pilot Program - $5.0 million
- Ferry Boat - $15.8 million
- FTA - $328.3 million
- RITA - $5.4 million
- FHWA - $20.8 million
Slide 16
San Francisco
- $158.7 million IF variable pricing is implemented on Doyle Drive by Sept 2009
- Doyle Drive is the 1.5 mile elevated roadway leading to the Golden Gate Bridge
- Will charge an extra (one-way-fee above the $5 toll on the Golden Gate Bridge); electronic collection
- Revenues will help pay to reconstruct the 70-year old Doyle Drive
- $1.6 million to cover up-front planning costs
- Tolling authority required by Spring 2008 to receive remainder of funds
- Significant because an existing facility will be priced
Slide 17
San Francisco
- Project Highlights - $158.7 Million Total
- Tolling Equipment
- Reconstruction of Doyle Drive
- Variable Pricing for On/Off Street Parking in Downtown San Francisco
- SFgo Arterial Traffic Management System/Traffic Controller Upgrades
- Improvements to Regional Ferry Service
- Creation of Integrated Mobility Accounts
- 511 Upgrades
Slide 18
San Francisco
- Partners
- Alameda-Contra Costa Transit District
- Bay Area Toll Authority
- San Francisco Country Transportation Authority
- California Department of Transportation
- Golden Gate bridge highway and Transportation District
- Metropolitan Transportation Commission
- San Francisco Municipal Transportation Agency
Slide 19
San Francisco
- Sources of Funds - $158.7 million
- FHWA - $80.1 million
- Public Lands - $47.3 million
- Value Pricing Pilot Program - $10.0 million
- Transportation Community, and System Preservation - $10.0 million
- Ferry Boat - $12.8 million
- FTA - $58.4 million
- RITA - $ 20.2 million
- FHWA - $80.1 million
Slide 20
Seattle
- $138.7 million IF legal authority is adopted and variable pricing is implemented on the State Route 520 floating bridge by September 2009
- King County crossing that currently carries about 160,000 people per day between Seattle and its Eastside suburbs
- Tolls on the existing bridge are intended to help pay for the new bridge
- $1.6 million to cover up-front planning costs
- Significant because this will be among the first of existing facilities to be priced
Slide 21
Seattle
- Project Highlights - $138.7 Million Total
- Implement variable pricing
- Enhance bus service and provide supporting amenities
- Regional ferry service
- Real-time multi-modal traveler information
- Active traffic management
Slide 22
Seattle
- Partners
- Washington State Department of Transportation
- Puget Sound Regional Council
- King County
Slide 23
Seattle
- Sources of Funds - $138.7
- FHWA - $50.7 million
- Innovative Bridge - $5.1 million
- Transportation, Community, and System Preservation $24.0 million
- Value Pricing Pilot Program - $10.0 million
- Ferry Boat - $11.6 million
- FTA - $41.0 million
- RITA - $47.0 million
- FHWA - $50.7 million
Slide 24
Minneapolis - St. Paul
- $133 million IF legal authority to implement congestion pricing has been adopted and placed in effect within 90 days following the opening of the next session of the Minnesota State legislature and the following happens on I-35W between downtown Minneapolis and the southern suburbs by September 30, 2009:
- Existing HOV lanes are converted to dynamically-priced HOT lanes (along the lines of the existing MnPASS operation)
- The existing HOT lanes are extended
- The shoulder lanes along the northbound portion of I-35W from 46th Street to downtown Minneapolis are dynamically priced
- $1.6 million to cover up-front planning costs
Slide 25
Minneapolis - St. Paul
- Project Highlights - $133.0 Million Total
- Conversion of the I-35W HOV lane to HOT; extension of HOT lanes; priced dynamic shoulder lanes
- Establish a Bus Rapid Transit lane into downtown Minneapolis
- Advanced BRT stations and park and ride facilities for the North metro suburbs along the I-35W corridor
- "Transit advantage" bypass lane/ramp
- Contra-flow transit lanes in downtown Minneapolis
- ITS Technology to improved transit services
- Arterial and freeway management
Slide 26
Minneapolis - St. Paul
- Partners
- Minnesota Department of Transportation
- Twin Cities Metropolitan Council
Slide 27
Minneapolis - St. Paul
- Sources of Funds - $133.0 million
- FHWA - $20.8 million
- Interstate Maintenance - $6.6 million
- Transportation, Community, and System Preservation - $16.4 million
- Value Pricing Pilot Program - $5.0 million
- FTA - $85.9 million
- RITA - $19.4 million
- FHWA - $20.8 million
Slide 28
Miami
- $62.9 million to establish 21 miles of HOT lanes on I-95 from Fort Lauderdale to downtown Miami (no new tolling authority required); HOV3+ free access
- SunPass electronic toll collection (requires new construction)
- Expand 10-lane highway to 12 lanes (by reducing the width of the existing lanes from 12 to 11 feet and using a portion of the shoulder)
- Revenues to fund construction and expand BTR
- All funds immediately available
Slide 29
Miami
- Project Highlights - $62.9 Million Total
- I-95 HOV to HOT Conversion
- Operation of BRT on HOT lanes
- Express Bus Service
- Transit Facility Improvements
Slide 30
Miami
- Partners
- Florida Department of Transportation
- Miami-Dade Metrop0olitan Planning Organization
- Broward Country metropolitan Planning Organization
- Broward Country Transit
- Miami-Date Transit
- Miami-Dade Expressway Authority
- Florida's Turnpike Enterprise
Slide 31
Miami
- Sources of Funds - $62.9 million
- FHWA - $43.4 million
- Interstate Maintenance - $43.4 million
- FTA - $19.5 million
- RITA - None
Slide 32
FHWA Responsibilities
- Fiscal oversight
- Reporting Requirements - Divisions to HOP to Multimodal Coordination to OST
- High Expectations
- Key is No Surprises
- Multimodal modeled after the initial UPA Team
- High interest/High visibility program - Congress, Media, OIG, GAO, OST
- Reporting Requirements - Divisions to HOP to Multimodal Coordination to OST
Slide 33
FHWA Responsibilities
- Expedited Approvals
- Again, key is no surprises
- Anticipate roadblocks and address quickly (engage all relevant parties - cross-Agency, cross-Department)
- Lessons Learned to Lessons Transferred
- Resource Center involvement
- Idea is to take the UPA experience and broadly promote/facilitate