Final Report: Pacific Estuarine Ecosystem Indicator Research (PEEIR) Consortium: Ecosystem Indicators Component
EPA Grant Number: R828676C001Subproject: this is subproject number 001 , established and managed by the Center Director under grant R828676
(EPA does not fund or establish subprojects; EPA awards and manages the overall grant for this center).
Center: Pacific Estuarine Ecosystem Indicator Research (PEEIR) Consortium
Center Director: Anderson, Susan L.
Title: Pacific Estuarine Ecosystem Indicator Research (PEEIR) Consortium: Ecosystem Indicators Component
Investigators: Morgan, Steven , Bennett, Bill , Cherr, Gary N. , Green, Peter , Grosholz, Edwin , Judah, Linda , Kuivila, Katherine , Nelson, Douglas , Nisbet, Roger M. , Smalling, Kelly , Spilseth, Sarah , Vines, Carol , Visinitainer, Tammie
Institution: University of California - Davis , U.S. Geological Survey , University of California - Santa Barbara
EPA Project Officer: Levinson, Barbara
Project Period: March 1, 2001 through February 28, 2005
RFA: Environmental Indicators in the Estuarine Environment Research Program (2000)
Research Category: Ecological Indicators/Assessment/Restoration
Description:
Objective:The objective of this research project was to develop a suite of ecological indicators to rapidly assess the integrity and sustainability of wetlands in West Coast estuaries. This project involved the development of an integrated suite of indicators to evaluate the impacts of stressors across levels of biological organization, trophic structure, life stage, time, and space.
Summary/Accomplishments (Outputs/Outcomes):Integrating Indicators Across Multiple Levels of Biological Organization: A Statistical Approach for Developing a Comprehensive Index of Fish Condition
Issue. Toxicologists have long struggled with approaches to determine the impacts of pollutants on populations of resident species. Use of individual indicators such as molecular and cellular biomarkers can provide sensitive and stressor-specific information of pollutant exposure/effect at the scale of cells, organs, or tissues of individuals. The use of multiple biomarker measurements on individuals, coupled with analysis of fish health and growth, can broaden the scope of such assessments, especially when multiple contaminants are present. This integrated approach would also permit managers to translate effects of pollutants on individuals to effects on populations.
Approach and Rationale. We developed a framework for statistically integrating multiple biomarker measurements from individuals of five California populations of a tidal marsh goby, the longjaw mudsucker (Gillichthys mirabilis), by identifying relationships between different contaminants and individual responses. The longjaw mudsucker is a resident species that spends the majority of its sedentary life within or in the near-vicinity of mud burrows in California tidal marshes. It is a very hardy species that tolerates wide variations in environmental conditions and pollutant levels and also is suitable for applying a wide variety of biomarker measurements.
A common multivariate technique, principal components analysis (PCA), was used in a step-wise fashion, allowing the investigator to make mechanistically relevant decisions about what to include at each phase of the analysis. This is a promising alternative to traditional statistical evaluations that typically rely on differences in average values from all individuals for each indicator. In this approach, the variation associated with fish size and other common variables is factored out in a step-wise manner so that variation associated with contaminant effects can be characterized. An additional advantage is that our approach is intuitively and computationally straightforward and can be used to categorize fish in a range from “healthy” to “impacted”. This strategy for integration of indicators for individuals, and then translating these responses into population level effects, includes three steps:
- Describe the interrelationships among biomarkers in statistical space to ask, “What are the fish telling us about habitat quality?”
- Separate matrices are constructed of indicator responses within individuals and pollutant stressors measured in the habitat.
- Interrelationships among biomarker responses then are examined using indices derived from principal components analysis.
- Interrelationships among pollutant stressors are similarly examined using indices derived from principal components analysis.
- Key indices of biomarker responses are then associated with similar indices derived from the matrix of pollutant stressors.
- Diagnose proportions of individual fish in different health categories from each marsh habitat.
- Health categories are defined using the signs (+ or -) of the rankings of individual fish on each index, and then the proportions of fish from each category for each marsh are compiled.
- Proportions of fish in each health category then are used to reflect the health of the population in each marsh, assuming the sample responses are proportional to those of the total population.
Findings and Impact. Indices integrating the responses of 16 biomarker measurements (11 morphometric and liver, as well as 5 gonad biomarkers) identify gradients in biomarker responses for individual fish that are interpreted by the factor loadings for each principal component (Figure 1).

Figure 1a. Scree Plot Showing the Amount of Variation in Fish Morphometric and Liver Biomarker Responses, or Information Explained in Each Principal Component. Typically, all components up to and including the fist major inflection point in this graph are worthy of consideration.

Figure 1b. Factor Loadings for the First Three Principal Components Shown in 1a. Factor loadings are coefficients that measure either the covariance, or correlation, between each of the original variables and each component. The magnitude of each loading is used for interpreting the information summarized by each principal component. Shadings show high positive (red) versus negative (blue) factor loadings used to interpret each component.

Figure 1c. Scree Plot Showing the Amount of Variation in Gonad Biomarker Responses Explained by Each Principal Component

Figure 1d. The Factor Loadings for the First Three Principal Components Shown in 1c. Shadings show high positive (red) versus negative (blue) factor loadings used to interpret each component.
The findings include:
- The first principal component although accounting for 35 percent of the variation in the morphometric and liver biomarker measures, represents primarily variation in fish size (Figure 1a, b), thus was excluded from further consideration.
- Similar indices identify gradients in chemical pollutant levels and among classes of pollutant stressors measured in five tidal marshes (Figure 2).

Figure 2a. Scree Plot Showing the Amount of Variation in Pollutant Levels Explained by Each Principal Component Using Pollutant Stressors Measured in Five Tidal Marshes
- Rankings of responses by individual fish on biomarker indices are associated with an index representing chemical pollutant levels (PC 1) measured in five tidal marshes (Figure 3a, c, e). Another index (PC 2) indicates the degree to which the biomarker responses are associated with organic versus metal pollutant stressors in the five tidal marshes (Figure 3b, d, f).
- Key biomarker indices identify the scope of individual responses in different marshes. In this example, individual scores (+ or –) are used to diagnose each fish into four health categories (Figure 4a).
- The numbers of individuals from each marsh sample scoring in each health category are used to reflect proportions of each fish population impacted by chemical pollutants, with the Stege Marsh population showing the greatest impacts (Figure 4b).
Applications. The framework outlined here for integrating indicators of environmental and pollutant response is applicable to a wide variety of aquatic organisms and situations where multiple stressors are suspected to underlie problems of declining populations or ecosystem quality. It is relatively simple and straightforward to modify for specific purposes and diagnosis criteria. Most importantly, this approach demystifies the longstanding issue of how to link information across multiple levels of biological organization into a population or ecosystem context. The value of this framework is that it is applicable as a general approach; however, for specific applications, numerous details may need to be tailored and refined.

Figure 2b. The Factor Loadings for the First Three Principal Components Shown in 2a. Shadings show high positive (red) versus negative (blue) factor loadings used to interpret each component.

Figure 3. Relationships of Three Biomarker Indices (Principal Components, PC) for Individual Fish with a Similar Index of Pollutant Levels (PC 1) as well as Organic Versus Metal Pollutants (PC 2) from Five Tidal Marshes in California. Color scheme denotes marsh and plotted points represent individual fish.

Figure 4a. Distribution of Fish Responses Along Two Biomarker Indices Used to Define Health Categories for the Five Fish Populations. Color scheme denotes marsh and plotted points represent individual fish.

Figure 4b. Summary Table Showing the Percent of Fish in Four Health Categories Used to Represent the Relative Impact of Pollutants on the Fish Populations
Shore Crabs as Sentinel Species for Monitoring Pollutant Effects in Estuaries
Issue. An increasingly diverse array of toxic pollutants with uncertain ecological effects is being discharged into coastal waters, and detecting their impacts on the condition of productive coastal habitats is one of the most important and difficult challenges facing environmental managers. Some of the challenges include:
- The concentration and complement of contaminants often vary from locale to locale.
- Chronic degradation caused by pollution is not readily detectable requiring many years for diverse communities to be replaced by fewer opportunistic species.
- Community change can persist long after visible effects of contamination disappear Traditional field surveys and laboratory toxicity bioassays are limited in meeting this challenge, yet promising new molecular and cellular biomarkers of sublethal effects largely have not been linked to the impairment of growth and reproduction, much less to declines in populations.
Approach and Rationale. Our approach was to establish a link among contaminants, molecular and cellular biomarkers, and reproductive impairment, using crabs as resident sentinel species for assessing habitat condition and diagnosing stressors.
Crabs make good biomonitors of habitat condition because they are ecologically important engineers of communities, sedentary, hardy, easily identified, abundant, long lived, present year-round, large enough to provide sufficient tissue for analysis of individuals, strong accumulators of contaminants, and brood embryos externally for easy inspection of abnormalities (Figure 5).
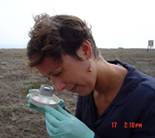


Figure 5. (left) Surveying Abnormal Embryos in the Field Using a Hand Lens. (middle) Cluster of embryos showing three distinctive abnormal embryos with white globules amid normal brown embryos. (right) Close-up view of a single abnormal embryo.
Findings and Impact. The lined shore crab, Pachygrapsus crassipes, was an effective indicator of habitat condition in California salt marshes at both large and small spatial scales.
- Seven measures of reproductive impairment accurately identified the most highly contaminated of three salt marshes.
- Reproductive impairment was a more sensitive measure of contaminant exposure than were traditional population surveys of adult crabs.
- Resident crabs and their embryos accumulated pollutants in time and space and provided a more accurate assessment of contaminant concentrations with less time and effort than did analytical surveys of chemical contaminants in sediments.
- In general, biomarkers were less effective at revealing habitat condition than was reproductive impairment.
- Crabs were effective indicators of small-scale variation in habitat condition. They moved little during a 3-month mark-recapture study and mirrored a nutrient gradient within a small marsh during a stable isotope study (Figure 6). Furthermore in the most contaminated marsh, the prevalence of DNA strand breaks and developmental abnormalities was related to the concentration of contaminants.
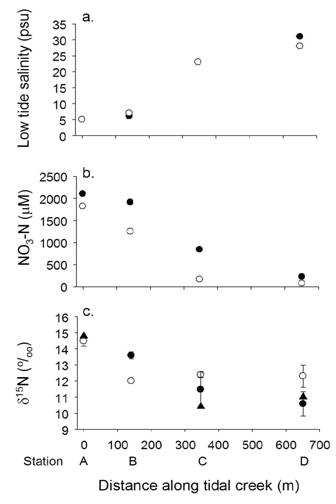
Figure 6. Variation in (a) Low Tide Salinity, (b) Concentration of Nitrate and (c) d15N Values of P. crassipes in March (filled circle) and September (open circle) 2003 and Enteromorpha clathrata in March 2003 (filled triangle) Along a Tidal Creek Receiving Freshwater Runoff from a Coastal Plain Highly Developed for Agriculture
Applications. The applications of the research include:
- This stressor-specific, vertically linked approach can be used by single investigators and state agencies to measure effects in resident species at both small and large spatial scales rather than extrapolating from toxicity test organisms.
- It can diagnose stress and provide early warning signs of threats to habitat condition and provide a rapid assessment of the condition of intact and restored habitats.
- Having a mechanistic understanding of the vertical linkage between contaminant exposure and multiple measures of reproductive impairment will improve the transferability of this approach to new locales with complex suites of contaminants.
- This approach can be applied wherever crabs are present.
Reproductive Performance of Shore Crabs as a Feasible Indicator of Pollutant Effects in Estuaries
Issue. Traditional field surveys and laboratory toxicity bioassays have not been adequate to detect the impacts of an increasingly diverse array of toxic pollutants, with uncertain ecological effects, on the condition of productive coastal habitats. Measuring reproductive impairment in resident species is an advantageous alternative approach because pollutants accumulate in tissues or have long term latent effects. It is important to provide time-integrated measures of geographical variation in exposure and effects; reproduction is a sensitive measure of contaminant exposure, the weak link in the life cycle and the ultimate measure of fitness.
Approach and Rationale. Our approach was to establish a link among contaminants and reproductive impairment using crabs as resident sentinels for assessing habitat condition and diagnosing stressors in three California salt marshes. Integrating responses of exposure to contaminants across different levels of biological organization and life stages is key to understanding mechanistic linkages for transferring indicators to new locales.
Findings and Impact. The lined shore crab, Pachygrapsus crassipes (Figure 7), is a hardy species occurring abundantly even at contaminated sites, and population surveys did not accurately reflect toxic exposure. Reproductive impairment was an effective indicator of habitat condition in California salt marshes at both large and small spatial scales and can be relied on to provide a sensitive measure of habitat condition wherever they occur (Morgan, et al., 2006).
The findings include:
- Reproductive output, embryo size, embryo weight, development time, developmental abnormalities, hatching success, and larval survival were greatest at the most highly contaminated of three salt marshes.

Figure 7. Pachygrapsus crassipes, the Lined Shore Crab. © Corrina Chase.

Figure 8. Discriminant Analysis of Metals in Crab Embryos Positioned in the Outer and Inner Portions of the Brood. Stege, Toms, and Walker are sites in northern California.
- Different suites of metal and organic contaminants occurred in externally brooded embryos among sites (Figure 8), and embryos provided a cost-effective estimate of variation in contaminant concentrations among sites.
- Embryos that were on the outer portion of the clutch contacting the sediment had higher contaminant burdens and developmental abnormalities (Figure 9) than did those positioned in the interior of the brood.

Figure 9. (a) Percentage of Crab Embryos with Developmental Abnormalities Positioned in the Outer and Inner Portions of the Brood. (b) One type of abnormal embryo (white) amid normal embryos (brown).
- Organic and metal contaminants were related to the prevalence of developmental abnormalities among and within marshes as well as within muddy creek bank and vegetated marsh habitats.
Applications. The applications of the research include:
- This stressor-specific, vertically linked approach can be used by single investigators and state agencies to provide early warning signs of threats to resident species at both small and large spatial scales providing a rapid assessment of the condition of intact and restored habitats wherever crabs are present.
- Developmental abnormalities are especially quick, easy, cost-effective, and nondestructive indicators of habitat condition, requiring a magnifying lens to provide an initial assessment of toxic exposure and forceps and a vial to sample embryos for laboratory analysis of contaminant concentrations.
- The link between exposure to various contaminants and different developmental abnormality types remains to be explored.
Journal Articles on this Report: 3 Displayed | Download in RIS Format
| Other subproject views: | All 32 publications | 14 publications in selected types | All 13 journal articles |
| Other center views: | All 133 publications | 35 publications in selected types | All 34 journal articles |
| Type | Citation | ||
|---|---|---|---|
|
|
Lafferty KD, Porter JW, Ford SE. Are diseases increasing in the ocean?. Annual Review of Ecology Evolution and Systematics 2004;35():31-54 |
R828676C001 (Final) |
not available |
|
|
Morgan SG, Spilseth SA, Page HM, Brooks AJ, Grosholz ED. Spatial and temporal movement of the lined shore crab Pachygrapsus crassipes in salt marshes and its utility as an indicator of habitat condition. Marine Ecology Progress Series 2006;314:271-281. |
R828676 (Final) R828676C001 (Final) |
not available |
|
|
Spilseth SA, Morgan SG. Evaluation of internal elastomer tags for small, mature crabs. Crustaceana 2005;78(11):1383-1388. |
R828676 (Final) R828676C001 (2004) R828676C001 (Final) R825689C028 (Final) |
not available |
watersheds, estuaries, ecological effects, bioavailability, ecosystem indicators, aquatic, integrated assessment, ecological effects, ecosystem indicators, , estuarine research, aquatic ecology, environmental indicators, ecosystem assessment, biological markers, biomarker, biomarkers, ecological assessment, ecological exposure, ecosystem condition, ecosystem health, ecosystem indicators, ecosystem integrity, environmental consequences, environmental indicators, environmental stress, environmental stressor, environmental stressors, estuaries, estuarine ecosystems, fish, plant indicator, statistical evaluation,
,
Ecosystem Protection/Environmental Exposure & Risk, ENVIRONMENTAL MANAGEMENT, Water, RFA, ECOSYSTEMS, Ecosystem/Assessment/Indicators, Risk Assessment, exploratory research environmental biology, estuarine research, Terrestrial Ecosystems, Ecological Monitoring, Ecological Indicators, Ecological Effects - Environmental Exposure & Risk, Ecosystem Protection, Aquatic Ecosystems, bioavailability, aquatic ecosystem, anthropogenic stresses, ecosystem indicators, ecological restoration, ecological risk assessment, environmental indicators, bioindicator, coastal ecosystems, wetlands, ecosystem restoration, wetland ecosystem, trophic effects, ecosystem assessment, estuaries, nutrients, aquatic ecology
Relevant Websites:
http://www.bml.ucdavis.edu/peeir/ ![]()
Progress and Final Reports:
2002 Progress Report
2003 Progress Report
2004 Progress Report
Original Abstract
Main Center Abstract and Reports:
R828676 Pacific Estuarine Ecosystem Indicator Research (PEEIR) Consortium
Subprojects under this Center:
(EPA does not fund or establish subprojects; EPA awards and manages the overall grant for this center).
R828676C000 Pacific Estuarine Ecosystem Indicator Research (PEEIR) Consortium: Administration and Integration Component
R828676C001 Pacific Estuarine Ecosystem Indicator Research (PEEIR) Consortium: Ecosystem Indicators Component
R828676C002 Pacific Estuarine Ecosystem Indicator Research (PEEIR) Consortium: Biological Responses to Contaminants Component: Biomarkers of Exposure, Effect, and Reproductive Impairment
R828676C003 Pacific Estuarine Ecosystem Indicator Research (PEEIR) Consortium: Biogeochemistry and Bioavailability Component