Chartbook #14: Racial and Ethnic Differences in Health Insurance Coverage and Usual Source of Health Care, 2002
By Michelle Roberts, B.A
Contents
The estimates in this report are based on the most recent data available from MEPS at the time the report was written. However, selected elements of MEPS data may be revised on the basis of additional analyses, which could result in slightly different estimates from those shown here. Please check the MEPS Web site for the most current file releases — www.meps.ahrq.gov.
The mission of AHRQ is to improve the quality, safety, efficiency, and effectiveness of health care for all Americans by:
- Using evidence to improve health care.
- Improving health care outcomes through research.
- Transforming research into practice.
Executive Summary
This report presents estimates of health insurance coverage and usual source of health care services during 2002 for Hispanic, non-Hispanic white, non-Hispanic black, non-Hispanic Asian, and other single/multiple race non-Hispanic Americans. Definitions of the racial and ethnic groups are shown in the Definitions of Terms section. Since "Hispanic" is an ethnic designation, Hispanics can be of any race. Key findings include the following.
Health Insurance Coverage
- Among Americans under age 65, Hispanics were almost three times as likely as non-Hispanic whites to be uninsured during 2002.
- Young non-Hispanic white and non-Hispanic Asian women were more likely to have private insurance coverage than young Hispanic and non-Hispanic black women.
- Hispanic workers were the least likely to have job-related health insurance coverage.
Usual Source of Health Care
- In 2002, Hispanics (32.8%), non-Hispanic Asians (27.1%), and non-Hispanic blacks (20.9%) were all more likely than non-Hispanic whites (15.2%) to lack a usual source of care.
- More than a third of Cuban Americans, Mexican Americans, and Hispanics in the "other" category (other than Puerto Rican, Cuban, or Mexican American) lacked a usual source of health care.
- Both Hispanic children and non-Hispanic Asian children were more than twice as likely as non-Hispanic white children to lack a usual source of care in 2002.
Return To Table Of Contents
Foreword
The mission of the Agency for Healthcare Research and Quality (AHRQ) is to improve the quality, safety, efficiency, and effectiveness of health care for all Americans. The Medical Expenditure Panel Survey (MEPS) helps AHRQ fulfill its mission by providing information on health care use and expenses, health insurance, health status, and a variety of demographic, social, and economic characteristics. MEPS is a set of large-scale surveys of families and individuals, their medical providers, and employers across the United States.
MEPS provides various ways of accessing the data so that it can be most useful to you. The MEPS Web site, www.meps.ahrq.gov, has:
- Online publications to read or download.
- MEPS public use data files that you can review and download.
- MEPSNet, which allows analysis of MEPS data using online statistical tools.
- Tables showing MEPS data displayed by some of the most frequently used characteristics.
AHRQ welcomes questions and comments from readers of this publication who are interested in obtaining more information about access, cost, use, financing, and quality of health care in the United States. We also invite you to tell us how you are using this Chartbook and other MEPS data and tools and to share suggestions on how MEPS products might be enhanced to further meet your needs. Please
e-mail us at mepspd@ahrq.gov or send a letter to the address below:
Steven B. Cohen, Ph.D.
Director
Center for Financing, Access, and Cost Trends
Agency for Healthcare Research and Quality
540 Gaither Road
Rockville, MD 20850
Return To Table Of Contents
Introduction
Despite technological advancements that have led to improvements in the overall quality of health for Americans, substantial differences in health remain between racial and ethnic groups. These differences have become the focus of a growing body of health services research and a considerable amount of public policy attention.
As a part of an annual report series, the 2005 National Healthcare Disparities Report (Agency for Healthcare Research and Quality, 2005) tracks disparities and gaps in the U.S. health care system. A major component of the 2005 report, as well as the 2004 and 2003 reports, is that people need to gain entry into the system before they can receive needed care. This chartbook examines two features of gaining entry into the U.S. health care system: health insurance coverage and usual source of care. Furthermore,
the 2005 Healthcare Disparities Report examines priority populations as specified by Congress in the Healthcare Research and Quality Act of 1999. This chartbook takes one priority population, racial and ethnic minority groups, and investigates differences in health insurance coverage and usual sources of care for those groups with respect to such demographic characteristics as gender, age, income, and minority subpopulation.
The chartbook is organized into two sections. The first section compares health insurance status for racial and ethnic groups, including differences in job-related health insurance. The second section addresses differences in usual sources of care among racial and ethnic groups.
Return To Table Of Contents
Source of Data for This Report
The estimates presented in this report come from the Medical Expenditure Panel Survey (MEPS). MEPS is a nationally representative survey of households, collecting detailed information on health status, health care use and expenses, and health insurance coverage of individuals and families in the U.S. civilian noninstitutionalized population.
Data for this chartbook come from MEPS public use file HC-070, the 2002 Full Year Consolidated Data File.
In some cases, totals may not add precisely to 100 percent because of rounding. In addition, because MEPS is based on a complex sample design, survey estimates are subject to statistical sampling error. Differences that appear large may not be statistically significant. Thus, only differences between groups that are statistically significant at the 0.05 level (not likely to be caused by sampling error) are noted in the text.
Return To Table Of Contents
Section 1: Health Insurance Coverage
Health insurance plays a critical role in ensuring that Americans get into the health care system to obtain timely medical care and have protection against expensive health care costs. This section looks at the status of health insurance coverage for a variety of racial and ethnic groups during 2002.
MEPS divides health insurance coverage into three categories:
- People classified as "any private" had private health insurance at some time during 2002.
- People who had no private coverage during 2002 but who had public insurance such as Medicaid or Medicare at any time during the year are described as "public only."
- People who did not have private or public insurance at any time during 2002 are identified as "uninsured."
Demographic characteristics, such as Hispanic subpopulations, gender, age, and income level, are also examined here.
Finally, since employers are the most common source of private health insurance coverage in the United States, this section explores differences arising from job-related health insurance coverage.
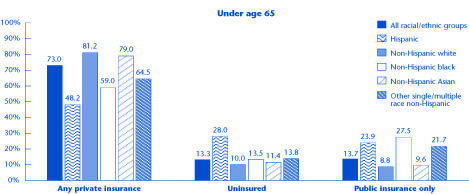
Who has coverage and who does not?
During 2002, 13.3% of Americans under age 65 were uninsured for the entire year. Hispanics were the racial/ethnic group most likely to be uninsured. Approximately 28.0% of Hispanics (10.4 million) lacked any type of health insurance all year.
- Hispanics were almost three times as likely as non-Hispanic whites, 2.5 times as likely as non-Hispanic Asians, and twice as likely as non-Hispanic blacks and other single/multiple race non-Hispanic Americans to lack health insurance coverage during 2002.
- Non-Hispanic whites and non-Hispanic Asians under age 65 were more likely to have private health insurance coverage than the other groups. About four-fifths of non-Hispanic whites and non-Hispanic Asians had private health insurance, compared to percents ranging from 48.2% to 64.5% for the other groups.
- With coverage rates ranging from 21.7% to 27.5%, Hispanics, non-Hispanic blacks, and other single/multiple race non-Hispanic Americans under age 65 were more likely to be covered by public health insurance than non-Hispanic whites (8.8%) and non-Hispanic Asians (9.6%).
Who has coverage and who does not?
Under age 65 |
| |
Any private insurance |
Uninsured |
Public Insurance only |
| All racial/ethnic groups |
73.0% |
13.3% |
13.7% |
| Hispanic |
48.2% |
28.0% |
23.9% |
| Non-Hispanic white |
81.2% |
10.0% |
8.8% |
| Non-Hispanic black |
59.0% |
13.5% |
27.5% |
| Non-Hispanic Asian |
79.0% |
11.4% |
9.6% |
Other single/multiple
race non-Hispanic |
64.5% |
13.8% |
21.7% |
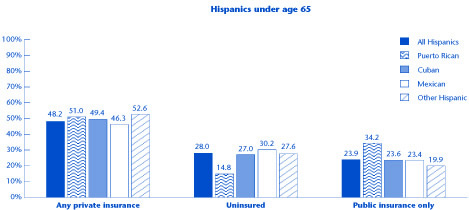
How does coverage differ among the
Hispanic subpopulations?
Uninsured rates were about the same for Cuban, Mexican, and other Hispanic Americans under age 65 during 2002.
- Each Hispanic subgroup except Puerto Ricans had similar rates of uninsurance, ranging from 27.0% to 30.2%.
- In 2002, 3 out of 10, or 7.5 million, Mexican Americans under age 65 were uninsured.
- Within the Hispanic subpopulations, Puerto Ricans under age 65 were the least likely to be uninsured during 2002 (only 14.8%).
- More than a third of Puerto Ricans had only public health care coverage during the year.
- Less than one-half of all Cuban and Mexican Americans had private health insurance at any time during 2002.
How does coverage differ among the
Hispanic subpopulations?
Hispanics under age 65 |
| |
Any private insurance |
Uninsured |
Public Insurance only |
| All Hispanics |
48.2% |
28.0% |
23.9% |
| Puerto Rican |
51.0% |
14.8% |
34.2% |
| Cuban |
49.4% |
27.0% |
23.6% |
| Mexican |
46.3% |
30.2% |
23.4% |
| Other Hispanic |
52.6% |
27.6% |
19.9% |
Does income affect the types of coverage held by racial/ethnic groups?
In both low-tier and high-tier income categories, Hispanics under age 65 were most likely to be uninsured.
Low-tier income category:
- More than one out of three Hispanics under age 65 lacked any type of health insurance coverage during 2002.
- Non-Hispanic whites, non-Hispanic Asians, and other single/multiple race non-Hispanics were the most likely to have private health insurance coverage.
High-tier income category:
- About one out of five Hispanics were uninsured during 2002.
- Hispanics were almost three times as likely as non-Hispanic whites, 2.6 times as likely as non-Hispanic Asians, and twice as likely as non-Hispanic blacks and other single/multiple race non-Hispanics to be uninsured for all of 2002.

Does income affect the types of coverage held by racial/ethnic groups?
Under age 65 |
| |
Any private insurance |
Uninsured |
Public Insurance only |
| All income groups |
73.0% |
13.3% |
13.7% |
All low-tier income
|
37.7% |
24.4% |
37.9% |
| Low-tier income Hispanic |
26.7% |
35.0% |
38.4% |
Low-tier income Non-Hispanic white
|
46.2% |
21.8% |
32.1% |
| Low-tier income Non-Hispanic black |
30.6% |
18.2% |
51.2% |
| Low-tier income Non-Hispanic Asian |
44.9% |
22.5% |
32.7% |
| Low-tier income Other single/multiple race non-Hispanic |
39.4% |
19.3% |
41.3v |
All high-tier income
|
87.7% |
8.6% |
3.7% |
| High-tier income Hispanic |
71.2% |
20.5% |
8.3% |
High-tier income Non-Hispanic white
|
90.5% |
6.9% |
2.6% |
| High-tier income Non-Hispanic black |
83.8% |
9.5% |
6.7% |
| High-tier income Non-Hispanic Asian |
89.7% |
7.9% |
2.4% |
| High-tier income Other single/multiple race non-Hispanic |
81.8% |
10.0% |
8.1% |
Note: Low-tier income—poor/near poor/low income.
High-tier income—middle/high income. |
How does coverage vary among females of different racial/ethnic groups?
Among females under 65, Hispanics were the most likely to be uninsured, non-Hispanic black females were the most likely to have public coverage, and non-Hispanic white and non-Hispanic Asian females were the most likely to have private health insurance coverage.
- One-quarter of all Hispanic females under 65 were uninsured in 2002. Hispanic females were almost three times as likely as non-Hispanic white females to be uninsured.
- More than three out of four non-Hispanic white and non-Hispanic Asian females were covered by private health insurance.
- Non-Hispanic black, Hispanic, and other single/multiple race females were the most likely to have public health insurance coverage.

How does coverage vary among females of different racial/ethnic groups?
Under age 65 |
| |
Any private insurance |
Uninsured |
Public Insurance only |
| Both sexes |
73.0% |
13.3% |
13.7% |
| All females |
72.9% |
11.8% |
15.3% |
| Females Hispanic |
47.7% |
25.4% |
26.9% |
Females Non-Hispanic
white |
81.2% |
9.0% |
9.9% |
Females Non-Hispanic
black |
58.7% |
11.3% |
30.1% |
Females Non-Hispanic
Asian |
79.1% |
11.2% |
9.7% |
Females Other single/
multiple race
non-Hispanic |
64.2% |
12.0% |
23.8% |
How does insurance vary among males of different racial/ethnic groups?
Hispanic males were more likely to be uninsured (30.4%) than to have public insurance (21.0%).
- In 2002, roughly 6 million Hispanic males under age 65 were uninsured. They were almost three times as likely as non-Hispanic white males to lack health insurance coverage.
- Hispanic males under 65 were more likely to be uninsured than to have public health insurance coverage.
- Less than one-half of Hispanic males under age 65 had private health insurance coverage (48.6%); they were the group least likely to have private health insurance.
- Non-Hispanic white and non-Hispanic Asian males under 65 were the most likely to have private insurance (about four-fifths of each group).

How does coverage vary among males of different racial/ethnic groups?
Under age 65 |
| |
Any private insurance |
Uninsured |
Public Insurance only |
| Both sexes |
73.0% |
13.3% |
13.7% |
| All males |
73.0% |
14.8% |
12.1% |
| Males Hispanic |
48.6% |
30.4% |
21.0% |
Males Non-Hispanic
white |
81.2% |
11.1% |
7.7% |
Males Non-Hispanic
black |
59.3% |
16.1% |
24.6% |
Males Non-Hispanic
Asian |
78.9% |
11.6% |
9.5% |
Males Other single/
multiple race
non-Hispanic |
64.9% |
15.7% |
9.5% |
Are children in certain racial/ethnic groups more likely to be uninsured?
Rates of public health insurance coverage did not significantly differ between Hispanic and non-Hispanic black children (44.1% and 48.6%, respectively) during 2002.
- Hispanic children were the most likely to be uninsured. They were three times as likely as non-Hispanic black children and more than twice as likely as non-Hispanic white children or other single/multiple race non-Hispanic children to lack any type of health insurance.
- Less than half of Hispanic and non-Hispanic black children had private insurance, compared to 77.3% of non-Hispanic white, 74.6% of non-Hispanic Asian, and 60.5% of other single/multiple race non-Hispanic children.

Are children in certain racial/ethnic groups more likely to be uninsured?
Under age 18 |
| |
Any private insurance |
Uninsured |
Public Insurance only |
| All children |
65.3% |
7.7% |
27.0% |
| Hispanic |
40.9% |
15.0% |
44.1% |
Non-Hispanic
white |
77.3% |
6.2% |
16.5% |
Non-Hispanic
black |
46.7% |
4.8% |
48.6% |
Non-Hispanic
Asian |
74.6% |
8.1% |
17.3% |
Other single/
multiple race
non-Hispanic |
60.5% |
5.6% |
33.9% |
Does health coverage differ among young adults by race/ethnicity?
Almost one-half of all young Hispanic men ages 18-24 (46.8%) lacked any type of health insurance coverage, compared to 17.3% of young adult non-Hispanic Asian men and 19.7% of young adult non-Hispanic white men.
- Young Hispanic men were 4.5 times as likely to be uninsured as to have public health insurance coverage.
- More than one-quarter of young non-Hispanic black men were uninsured.
- More than one out of four young Hispanic and non-Hispanic black women had public insurance coverage.
- One-third of all young Hispanic women were uninsured.
- Young non-Hispanic white and non-Hispanic Asian females were more likely to have private insurance coverage than young Hispanic and non-Hispanic black women.
- All young men ages 18-24 were more likely to be uninsured (26.2%) than to have public health insurance coverage (6.8%).

Does health coverage differ among
young adults by race/ethnicity?
Young adults ages 18-24 |
| |
Any private insurance |
Uninsured |
Public Insurance only |
| All young adults Men |
67.0% |
26.2% |
6.8% |
| All young adults Women |
64.9% |
19.0% |
16.1% |
| Hispanic Men |
42.8% |
46.8% |
10.4% |
| Hispanic Women |
39.0% |
33.8% |
27.2% |
Non-Hispanic
white Men |
76.6% |
19.7% |
3.7% |
Non-Hispanic
white Women |
74.4% |
15.0% |
10.6% |
Non-Hispanic
black Men |
56.6% |
28.5% |
14.9% |
Non-Hispanic
black Women |
53.2% |
19.1% |
27.7% |
Non-Hispanic
Asian Men |
70.0% |
17.3% |
12.8% |
Non-Hispanic
Asian Women |
73.3% |
4.9% |
11.8% |
Other single/
multiple race
non-Hispanic Men |
54.4% |
37.7% |
7.9% |
Other single/
multiple race
non-Hispanic Women |
56.3% |
25.1% |
18.7% |
Does job-related health coverage differ by race/ethnicity?
Non-Hispanic white and non-Hispanic Asian workers were the most likely to have job-related health insurance coverage in 2002.
- More than four-fifths of non-Hispanic white and non-Hispanic Asian workers had job-related health insurance.
- Hispanic workers were the least likely to have job-related health insurance coverage; only 57.5% had employer-sponsored insurance.

Does job-related health coverage
differ by race/ethnicity?
Workers ages 16-64 with
job-related health insurance |
| All workers ages 16-64 |
76.8% |
| Hispanic |
57.5% |
Non-Hispanic
white |
81.0% |
Non-Hispanic
black |
72.1% |
Non-Hispanic
Asian |
81.6% |
Other single/
multiple race
non-Hispanic |
68.4% |
Does job-related health coverage differ among the Hispanic subpopulations?
Rates of job-related health insurance did not significantly differ for Cuban Americans, Mexican Americans, and other Hispanic workers during 2002.
- 52.8% of Cubans, 55.9% of Mexicans, and 58.9% of other Hispanic workers had job-related health insurance coverage.
- Two-thirds of Puerto Rican workers had job-related coverage, compared to slightly more than one-half of Mexican American workers.

Does job-related health coverage
differ among the Hispanic subpopulations?
Hispanic workers ages 16-64
with job-related health insurance |
| All Hispanic workers ages 16-64 |
57.5% |
| Puerto Rican |
66.6% |
| Cuban |
52.8% |
| Mexican |
55.9% |
| Other Hispanic |
58.9% |
What gender differences exist in job-related health coverage among racial/ethnic groups?
During 2002, male Hispanic workers were the group least likely to have health coverage from an employer.
- Among employed males, slightly more than half of Hispanics (54.6%) had job-related coverage, compared to about 8 out of 10 for non-Hispanic whites and non-Hispanic Asians and 7 out of 10 for non-Hispanic blacks and other single/multiple race non-Hispanics.
- Female Hispanic workers were more likely than Hispanic male workers to have job-related coverage.
- Among employed females, about 8 out of 10 non-Hispanic whites and non-Hispanic Asians had job-related coverage, compared to rates of 6 to 7 out of 10 for Hispanics, non-Hispanic blacks, and other single/multiple race non-Hispanics.

What gender differences exist in
job-related health coverage
among racial/ethnic groups?
Workers ages 16-64
with job-related health insurance |
| All workers ages 16-64 Men |
75.9% |
| All workers ages 16-64 Women |
77.8% |
| Hispanic Men |
54.6% |
| Hispanic Women |
61.5% |
Non-Hispanic
white Men |
80.7% |
Non-Hispanic
white Women |
81.3% |
Non-Hispanic
black Men |
71.0% |
Non-Hispanic
black Women |
73.0% |
Non-Hispanic
Asian Men |
80.9% |
Non-Hispanic
Asian Women |
82.2% |
Other single/
multiple race
non-Hispanic Men |
69.4% |
Other single/
multiple race
non-Hispanic Women |
67.5% |
Are there income-related differences in job-related health coverage among racial/ethnic groups?
Among poor, near poor, and low-income workers, Hispanics were the least likely to have job-related health insurance coverage during 2002.
- Among low-tier income workers, 34.7% of Hispanics had insurance from their employer, compared to rates of 44.1% to 52.1% for the remaining racial/ethnic groups.
- Among high-tier income workers, 72.9% of Hispanic workers had job-related health insurance, compared to rates of 84.7% to 87.8% for the remaining racial/ethnic groups.

Are there income-related differences
in job-related health coverage among
racial/ethnic groups?
Workers ages 16-64 with
job-related health insurance |
| All low-tier income |
44.5% |
| Low tier income Hispanic |
34.7% |
Low tier-income Non-Hispanic
white |
48.8% |
Low tier-income Non-Hispanic
black |
44.1% |
Low tier-income Non-Hispanic
Asian |
52.1% |
Low tier-income Other single/
multiple race
non-Hispanic |
45.1% |
| All high-tier income |
85.2% |
| High-tier Hispanic |
72.9% |
High-tier Non-Hispanic
white |
86.8% |
High-tier Non-Hispanic
black |
84.7% |
High-tier Non-Hispanic
Asian |
87.8% |
High-tier income Other single/
multiple race
non-Hispanic |
79.0% |
Note: Low-tier income—poor/near poor/low income.
High-tier income—middle/high income. |
Return To Table Of Contents
Section 2: Usual Source of Health Care
Having adequate access to health care services can significantly influence health care use and health outcomes. One way to measure access to care is to ask whether people have a usual source of care-that is, ask people whether they have a person or place they usually go to if they are sick or in need of advice about their health. Lacking a usual source of care may also have important implications for the quality and continuity of care received. Studies have shown that people who do not have a usual source of care reduce their
chances to receive necessary health care services, which can result in poor health outcomes (DeVoe, Fryer, Philips, et al., 2003). In addition, people without a usual source of health care are less likely to obtain a variety of preventive health care services (Weinick, Zuvekas, and Drilea, 1997).
This section describes racial and ethnic differences in usual source of care for 2002.
Are some racial/ethnic groups more likely to lack a usual source of care?
In 2002, Hispanics (32.8%), non-Hispanic Asians (27.1%), and non-Hispanic blacks (20.9%) were all more likely than non-Hispanic whites (15.2%) to lack a usual source of care.
- Nearly a third of Hispanics did not have a usual source of care. They were the racial/ethnic group most likely to be without a usual source of health care.
- Almost three-fourths of non-Hispanic whites had an office-based source of health care, compared to slightly more than half of Hispanics.
- Non-Hispanic blacks, Hispanics, and other single/multiple race non-Hispanics were more likely than non-Hispanic whites to have a hospital-based source of care.

Are some racial/ethnic groups more likely
to lack a usual source of care?
All ages
Usual source of health care |
| |
Office based |
Hospital based |
None |
| Total |
68.0% |
13.2% |
18.8% |
| Hispanic |
51.4% |
15.9% |
32.8% |
Non-Hispanic
white |
72.9% |
11.9% |
15.2% |
Non-Hispanic
black |
62.6% |
16.6% |
20.9% |
Non-Hispanic
Asian |
59.6% |
13.2% |
27.1% |
Other single/
multiple race
non-Hispanic |
62.6% |
18.8% |
18.6% |
What differences exist among the Hispanic sub-populations regarding a usual source of health care?
More than a third of Cuban Americans, Mexican Americans, and other Hispanics did not have a usual source of health care.
- 37.4% of Cubans, 34.1% of Mexicans, and 34.4% of other Hispanics did not have a usual source of health care.
- Puerto Ricans were the least likely to lack a usual source of health care (19.7%).

What differences exist among the Hispanic
sub-populations regarding a usual source of health care?
Hispanics, all ages
Usual source of health care |
| |
Office based |
Hospital based |
None |
| All Hispanics |
51.4% |
15.9% |
32.8% |
| Puerto Rican |
59.0% |
21.4% |
19.7% |
| Cuban |
52.2% |
10.4% |
37.4% |
| Mexican |
50.7% |
15.2% |
34.1% |
| Other Hispanic |
49.4% |
16.2% |
34.4% |
Are there racial/ethnic differences in usual source of medical care for people in the low-tier income group?
In the low-tier income category, Hispanics were the most likely to lack a usual source of care.
- In 2002, among people in the low-tier income category, more than one in three Hispanics did not have a usual source of care. In comparison, 20.0% to 26.8% of other groups with low income lacked a usual source of care.
- In this income category, Hispanics also were the least likely to have an office-based source of medical care. Less than half of Hispanics in the low-tier income category had an office-based source of care, compared to more than two-thirds of non-Hispanic whites.

Are there racial/ethnic differences in usual source
of medical care for people in the low-tier income group?
All ages, low-tier income
Usual source of health care |
| |
Office based |
Hospital based |
None |
| Total |
59.8% |
15.7% |
24.5% |
| Hispanic |
46.8% |
16.5% |
36.7% |
Non-Hispanic
white |
67.0% |
13.1% |
20.0% |
Non-Hispanic
black |
57.7% |
20.6% |
21.7% |
Non-Hispanic
Asian |
56.3% |
16.9% |
26.8% |
Other single/
multiple race
non-Hispanic |
54.5% |
22.1% |
23.4% |
| Note: Low-tier income—poor/near poor/low income. |
Are there racial/ethnic differences in usual source of care for people in the high-tier income group?
Hispanics and non-Hispanic Asians in the high-tier income group were the most likely to lack a usual source of care in 2002.
- 28.6% of Hispanics and 27.2% of non-Hispanic Asians in the high-tier income category had no specific source or place to receive ongoing health care services.
- Among those in the high-tier income category, Hispanics were the least likely to have an office-based source of health care (56.3%).

Are there racial/ethnic differences in usual source
of medical care for people in the high-tier income group?
All ages, high-tier income
Usual source of health care |
| |
Office based |
Hospital based |
None |
| Total |
71.5% |
12.2% |
16.3% |
| Hispanic |
56.3% |
15.2% |
28.6% |
Non-Hispanic
white |
74.7% |
11.6% |
13.7% |
Non-Hispanic
black |
67.1% |
12.8% |
20.1% |
Non-Hispanic
Asian |
60.7% |
12.1% |
27.2% |
Other single/
multiple race
non-Hispanic |
68.5% |
16.4% |
15.2% |
| Note: Low-tier income—poor/near poor/low income. |
Are there racial/ethnic differences among women related to usual source of care?
Hispanic and non-Hispanic Asian women were the most likely to lack a usual source of care in 2002.
- 33.2% of Hispanic women and 31.4% of non-Hispanic Asian women ages 18-64 did not report a usual source of care to obtain ongoing health services.
- Non-Hispanic white women were the most likely to have an office-based source of health care; almost three-fourths of them received their usual health care service in an office setting.

Are there racial/ethnic differences among women
related to usual source of care?
Ages 18-64
Usual source of health care |
| |
Office based |
Hospital based |
None |
| Both sexes |
62.2% |
12.9% |
24.8% |
| All women |
67.0% |
13.4% |
19.6% |
| Women Hispanic |
50.2% |
16.6% |
33.2% |
Women Non-Hispanic
white |
72.0% |
12.2% |
15.8% |
Women Non-Hispanic
black |
61.5% |
16.6% |
22.0% |
Women Non-Hispanic
Asian |
56.3% |
12.3% |
31.4% |
Women Other single/
multiple race
non-Hispanic |
61.0% |
18.7% |
20.3% |
Are there racial/ethnic differences among men related to having a usual source of care?
Hispanic men were the most likely to lack a usual source of care and the least likely to have an office-based source of care in 2002.
- More than one-half of Hispanic men ages 18-64 had no usual source of care.
- Hispanic men were twice as likely as non-Hispanic white men to be without a usual source of health care.
- Hispanic men were the least likely and non-Hispanic white men were the most likely to have an office-based source of care.
- The percent of men whose usual source of care was hospital based did not vary significantly by racial/ethnic group.

Are there racial/ethnic differences among men
related to having a usual source of care?
Ages 18-64
Usual source of health care |
| |
Office based |
Hospital based |
None |
| Both sexes |
62.2% |
12.9% |
24.8% |
| All men |
57.3% |
12.4% |
30.2% |
| Men Hispanic |
36.5% |
12.1% |
51.5% |
Men Non-Hispanic
white |
63.2% |
12.1% |
24.7% |
Men Non-Hispanic
black |
50.9% |
13.3% |
35.7% |
Men Non-Hispanic
Asian |
51.0% |
14.1% |
34.9% |
Men Other single/
multiple race
non-Hispanic |
48.2% |
18.0% |
33.8% |
Are children in some racial/ethnic groups more likely to lack a usual source of care?
Both Hispanic children and non-Hispanic Asian children were more than twice as likely as non-Hispanic white children to lack a usual source of care in 2002.
- Both Hispanic children and non-Hispanic Asian children were less likely than non-Hispanic white children to have an office-based usual source of care.
- In 2002, Hispanic children and non-Hispanic black children were more likely than non-Hispanic white children to have a hospital-based source of care.

Are children in some racial/ethnic groups more
likely to lack a usual source of care?
Children under age18
Usual source of health care |
| |
Office based |
Hospital based |
None |
| All children |
76.0% |
14.0% |
10.0% |
| Hispanic |
64.2% |
17.8% |
18.0% |
Non-Hispanic
white |
80.9% |
11.9% |
7.1% |
Non-Hispanic
black |
72.5% |
17.0% |
10.5% |
Non-Hispanic
Asian |
70.6% |
13.4% |
16.0% |
Other single/
multiple race
non-Hispanic |
72.9% |
18.4% |
8.7% |
Does usual source of care differ for
young adults?
Half of all young Hispanic adults lacked a usual source of care in 2002.
- Among young adults ages 18-24, Hispanics were almost twice as likely as non-Hispanic whites to lack a specific source of ongoing health care services.
- Young adults did not differ significantly by racial/ethnic group in their use of hospitals as a usual source of health care services.

Does usual source of care differ for
young adults?
Young adults ages 18-24
Usual source of health care |
| |
Office based |
Hospital based |
None |
| All young adults |
53.3% |
11.7% |
34.9% |
| Hispanic |
38.9% |
11.0% |
50.1% |
Non-Hispanic
white |
59.3% |
11.9% |
28.8% |
Non-Hispanic
black |
47.8% |
11.3% |
40.9% |
Non-Hispanic
Asian |
49.3% |
12.8% |
37.9% |
Other single/
multiple race
non-Hispanic |
42.2% |
14.1% |
43.7% |
Return To Table Of Contents
References
Agency for Healthcare Research and Quality. 2005 National Healthcare Disparities Report. Rockville (MD): Department of Health and Human Services; Agency for Healthcare Research and Quality; Dec 2005. AHRQ Pub. No. 06-0017.
Cohen S. Design strategies and innovations in the Medical Care Expenditure Panel Survey. Medical Care 2003 (Jul); 41(7 Suppl): :III5-III12.
DeVoe JE, Fryer GE, Phillips R, et al. Receipt of preventive care among adults: insurance status and usual source of care. American Journal of Public Health 2003 (May); 93:786-91.
Kass BL, Weinick RM, Monheit AC. Racial and ethnic differences in health, 1996. Rockville (MD): Agency for Health Care Policy and Research; 1999. MEPS Chartbook No. 2. AHCPR Pub. No. 99-0001.
Weinick RM, Zuvekas SH, Drilea SK. Access to health care--sources and barriers, 1996. Rockville (MD): Agency for Health Care Policy and Research; 1997. MEPS Research Findings No. 3. AHCPR Pub. No. 98-0001.
Definition of Terms
Race/ethnicity
Comparisons by racial/ethnic groups in this chartbook are based on the following five race/ethnicity groups: non-Hispanic whites, non-Hispanic blacks, non-Hispanic Asians, other single/multiple race non-Hispanics, and Hispanics (of any race). The other single/multiple race non-Hispanic category includes American Indians, Aleutian Islanders, Eskimos, and any other unspecified races. While the health experience of these groups in the other category is of interest, MEPS samples too few individuals to present reliable data on them. In addition, beginning in 2002, MEPS respondents had the option of reporting multiple races. These persons were also included in the other single/multiple race non-Hispanic category.
Race and ethnicity classifications were determined from information reported for each family member. Respondents were asked if each family member's race was best described as American Indian, Alaska Native, Asian or Pacific Islander, black, white, or other. They also were asked if each family member's main national origin or ancestry was Puerto Rican; Cuban; Mexican, Mexicano, Mexican American, Chicano; other Latin American; or other Spanish. All persons whose main national origin or ancestry was reported in one of these Hispanic groups, regardless of racial background, were classified as Hispanic. Since the Hispanic grouping can include black Hispanics, white Hispanics, Asian and Pacific Islander Hispanics, and other Hispanics, the race categories of black, white, Asian, and other do not include Hispanics.
Health insurance status
The health insurance information in this chartbook is for coverage during 2002. Respondents were asked about health insurance coverage for themselves and all household members at each round of interviewing. The insurance variables reflect coverage for hospital and physician services.
Any private insurance category includes those who at any time during 2002 had any private insurance coverage, including TRICARE/VA (which covers retired members of the Uniformed Services and the spouses and children of active-duty military). In this chartbook, private health insurance coverage also includes individual or group plan coverage for medical or related expenses and prepaid health plans such as health maintenance organizations. It excludes extra-cash coverage plans, medical benefits linked only to specific diseases (dread disease plans), and casualty benefit plans (such as automobile insurance).
Public insurance only includes persons who were never covered by private insurance during 2002 but who were covered at any time by Medicare, Medicaid, or other State and local medical assistance programs.
Uninsured comprises all persons with neither public nor private insurance coverage at any time during 2002.
Income categories
Income categories were determined by the ratio of family income to the Federal poverty threshold for 2002, which varies by family size and age of head of family. The two income categories in the chartbook are defined as follows:
Low-tier or poor, near poor, and low income category includes persons in families with incomes less than or equal to 200% of the poverty line.
High-tier or middle and high income category includes persons in families with incomes over 200% of the poverty line.
Usual source of care
For each individual family member, MEPS ascertains whether there is a particular doctor's office, clinic, health center, or other place that the individual usually goes to if he/she is sick or needs advice about his/her health.
Return To Table Of Contents
| Suggested Citation: Chartbook #14: Racial and Ethnic Differences in Health Insurance Coverage and Usual Source of Health Care, 2002. March 2006. Agency for Healthcare Research and Quality, Rockville, MD. http://www.meps.ahrq.gov/data_files/publications/cb14/cb14.shtml |
|