Internet Address: http://www.bls.gov/ro2/home.htm   Transmission of material in
Media Contact: Michael L. Dolfman,(212) 337-2500    this release is embargoed
Information: Martin Kohli,(646) 264-3620            until after 8:30 A.M. (EDT)
                                                    Friday, June 13, 2008
NEW YORK-NORTHERN NEW JERSEY CPI UP 1.0 PERCENT IN MAY,
4.0 PERCENT RISE FROM YEAR AGO
Retail prices in the greater New York area, as measured by the
Consumer Price Index for All Urban Consumers (CPI-U), rose 1.0
percent in May, following a 0.3-percent increase in April. Michael
L. Dolfman, Regional Commissioner of the U. S. Department of Labor's
Bureau of Labor Statistics, attributed the May advance to a sharp
increase in energy prices. Higher prices for food and beverages also
contributed to the rise. For the year ended in May 2008, the CPI-U
increased 4.0 percent, and core inflation, as measured by the all
items less food and energy index, was 2.1 percent.
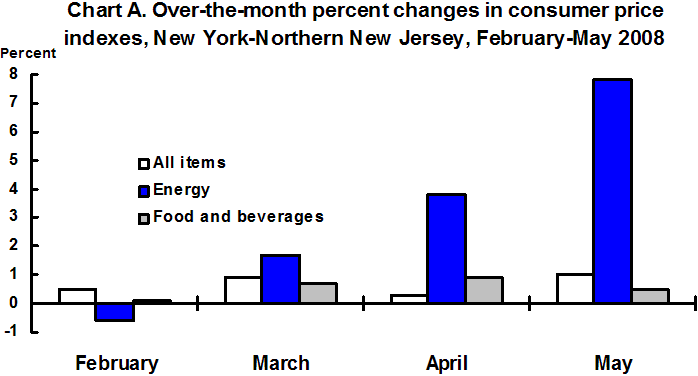
The energy index jumped 7.8 percent in May, the largest single-
month rise since September 2005, when energy prices spiked following
Hurricane Katrina. After a downturn in February, energy price
increases accelerated from 1.7 percent in March to 3.8 percent in
April. (See chart A.) The May increase was mostly attributable to a
12.7-percent advance in gasoline prices, which had risen 4.2 percent
in March and 5.8 percent in April. Charges for natural gas,
residential fuel oil, and electricity also contributed to the May
increase in energy prices. Over the year, energy prices rose 19.2
percent, with gasoline up 25.5 percent and household energy up 13.2
percent.
The food and beverages index climbed 0.5 percent, following a 0.9-
percent advance in April. May was the 14th consecutive rise in the
index, marking the longest series of monthly increases since 1980-81.
The food-at-home component rose 0.7 percent over the month. Rice,
pasta, and cornmeal; bread; apples; and frozen fruits and vegetables
were among the groceries with higher May prices. The index for food
away from home rose 0.4 percent. For the year ended in May 2008, food
and beverage prices increased 5.5 percent.
 New York-Northern New Jersey CPI monthly and annual percent changes
(not seasonally adjusted)
| 2003 | 2004 | 2005 | 2006 | 2007 | 2008
Month | Mo | Ann | Mo | Ann | Mo | Ann | Mo | Ann | Mo | Ann | Mo | Ann
January 0.8 3.3 0.3 2.7 0.6 4.1 0.8 3.7 0.2 2.7 0.2 3.7
February 0.8 3.3 0.6 2.5 0.4 3.9 0.2 3.6 0.6 3.1 0.5 3.6
March 0.5 3.1 1.1 3.2 1.7 4.4 0.8 2.7 0.7 2.9 0.9 3.8
April -0.2 2.6 0.3 3.7 0.0 4.2 0.9 3.6 0.5 2.5 0.3 3.6
May 0.1 2.8 0.2 3.9 -0.5 3.4 0.6 4.8 0.6 2.5 1.0 4.0
June 0.1 2.8 0.8 4.6 -0.3 2.3 0.5 5.6 0.5 2.5
July 0.4 3.0 -0.2 3.9 0.9 3.4 0.2 5.0 0.2 2.5
August 0.7 3.1 0.1 3.3 0.8 4.1 0.4 4.7 -0.1 1.9
September 0.3 3.3 0.1 3.2 0.8 4.8 -0.5 3.3 0.0 2.4
October 0.2 3.3 0.7 3.7 0.4 4.5 -0.5 2.4 0.1 3.1
November -0.3 3.1 0.0 3.9 -0.6 3.9 -0.4 2.6 0.4 3.9
December -0.1 3.2 -0.2 3.8 -0.5 3.6 0.2 3.3 0.0 3.7
The transportation index advanced 4.2 percent over the month,
largely reflecting the jump in gasoline prices. The May index also
reflected higher prices for motor fuels other than gasoline and for
air transportation. Over the year, transportation prices increased
9.6 percent, the largest 12-month advance since September 2005.
The housing index increased 0.4 percent in May, following a 0.2-
percent decline in April. The fuels and utilities component advanced
3.1 percent, largely due to the increases in natural gas and
residential fuel oil. The household furnishings and operations
component rose 0.8 percent over the month. Shelter prices, however,
were unchanged during May, after falling 0.4 percent in April. A
decline in charges for out-of-town lodging offset increases of 0.3
percent for owners' equivalent rent and 0.2 percent for residential
rent.
Among other expenditure categories, the medical care index
increased 1.1 percent. The apparel index registered a 0.9-percent
upturn in May, but was down 4.0 percent over the year. The education
and communication index rose 0.4 percent over the month, boosted by
higher long distance telephone charges. The other goods and services
index increased 0.5 percent, with higher cigarette prices, and the
recreation index inched up 0.1 percent.
With the New York-Northern New Jersey Consumer Price Index for All
Urban Consumers at 236.151 in May (1982-84=100), $23.62 was required
to purchase what $10 could in the 1982-84 base period. The
purchasing power of the dollar was 42.3 cents in 1982-84 dollars and
14.6 cents in 1967 dollars. In May, the Consumer Price Index for
Urban Wage Earners and Clerical Workers (CPI-W) was 230.923, up 1.2
percent over the month. The CPI-W rose 4.3 percent over the year.
On a 1967 base, the May CPI-W was 657.496.
Data in this report are not seasonally adjusted. Accordingly,
month-to-month changes may reflect the impact of seasonal influences.
The New York-Northern New Jersey-Long Island, NY-NJ-CT-PA
consolidated area comprises the five boroughs of New York City,
Nassau, Suffolk, Westchester, Rockland, Putnam, Dutchess, and Orange
Counties in New York State; Bergen, Essex, Hudson, Hunterdon, Mercer,
Monmouth, Middlesex, Morris, Ocean, Passaic, Somerset, Sussex, Union
and Warren Counties in New Jersey; Fairfield County and parts of
Litchfield, New Haven and Middlesex Counties in Connecticut; and Pike
County in Pennsylvania.
NYLS - 7334 Labor - New York
06/12/08
Consumer Price Index for All Urban Consumers (CPI-U): Indexes and percent changes for selected periods
New York-Northern N.J.-Long Island, NY-NJ-CT-PA (1982-84=100 unless otherwise noted)
Indexes Percent change from-
Item and Group
Mar. Apr. May May Mar. Apr.
2008 2008 2008 2007 2008 2008
Expenditure category
All items........... 233.122 233.822 236.151 4.0 1.3 1.0
All items (1967=100) 673.924 675.948 682.680 - - -
Food and beverages 217.953 220.009 221.159 5.5 1.5 .5
Food.............. 216.948 219.236 220.416 5.7 1.6 .5
Food at home..... 215.803 218.925 220.396 5.9 2.1 .7
Food away from
home......... 224.132 225.469 226.328 5.5 1.0 .4
Alcoholic
beverages..... 228.860 227.398 228.074 3.7 -.3 .3
Housing............ 252.586 252.200 253.161 3.2 .2 .4
Shelter........... 304.244 303.015 303.001 2.6 -.4 .0
Rent of primary
residence 1/ 290.943 291.938 292.639 4.5 .6 .2
Owners'
equivalent
rent of
primary
residence 1/
2/ ......... 308.414 309.225 310.265 3.1 .6 .3
Fuels and
utilities..... 197.303 201.039 207.321 12.3 5.1 3.1
Household energy 199.579 203.684 210.660 13.2 5.6 3.4
Gas (piped) and
electricity
1/......... 186.483 189.437 194.648 5.5 4.4 2.8
Electricity 1/ 165.808 169.629 171.415 3.1 3.4 1.1
Utility (piped)
gas service
1/........ 226.907 227.722 240.687 9.3 6.1 5.7
Household
furnishings
and operations 127.754 127.503 128.486 -2.0 .6 .8
Apparel............ 112.728 111.844 112.882 -4.0 .1 .9
Transportation..... 200.012 203.058 211.635 9.6 5.8 4.2
Private
transportation 189.936 193.421 202.221 9.8 6.5 4.5
Motor fuel....... 247.212 261.591 294.561 25.7 19.2 12.6
Gasoline (all
types)...... 245.733 259.935 292.904 25.5 19.2 12.7
Gasoline,
unleaded
regular 3/ 249.334 264.346 298.627 26.0 19.8 13.0
Gasoline,
unleaded
midgrade
3/ 4/.... 244.449 257.141 288.883 24.7 18.2 12.3
Gasoline,
unleaded
premium 3/ 241.152 254.028 284.199 24.4 17.9 11.9
Medical care....... 366.596 365.956 369.871 2.8 .9 1.1
Recreation 5/..... 113.542 114.919 115.043 .4 1.3 .1
Education and
communication
5/............ 127.688 127.836 128.332 3.8 .5 .4
Other goods and
services....... 341.966 341.909 343.477 2.3 .4 .5
Commodity and service group
All items........... 233.122 233.822 236.151 4.0 1.3 1.0
Commodities........ 178.566 180.466 183.881 5.4 3.0 1.9
Commodities less
food and
beverages..... 150.731 152.462 156.802 5.2 4.0 2.8
Nondurables less
food and
beverages.... 183.522 186.936 195.282 9.1 6.4 4.5
Durables......... 108.113 107.876 107.527 -2.0 -.5 -.3
Services........... 279.870 279.574 281.010 3.2 0.4 0.5
Special aggregate indexes
All items less
medical care.... 227.055 227.793 230.053 4.0 1.3 1.0
All items less
shelter......... 205.228 206.779 210.162 4.8 2.4 1.6
Commodities less
food............ 154.042 155.690 159.952 5.2 3.8 2.7
Nondurables......... 202.929 205.745 210.771 7.4 3.9 2.4
Nondurables less
food............ 186.564 189.731 197.699 8.8 6.0 4.2
Services less rent
of shelter 2/ 262.143 263.044 266.407 4.0 1.6 1.3
Services less
medical care
services........ 272.565 272.280 273.482 3.2 .3 .4
Energy.............. 220.181 228.579 246.402 19.2 11.9 7.8
All items less
energy.......... 236.006 235.958 236.787 2.6 .3 .4
All items less food
and energy..... 240.980 240.489 241.256 2.1 .1 .3
1/ This index series was calculated using a Laspeyres estimator. All other item
stratum index series were calculated using a geometric means estimator.
2/ Index is on a December 1982=100 base.
3/ Special index based on a substantially smaller sample.
4/ Indexes on a December 1993=100 base.
5/ Indexes on a December 1997=100 base.
- Data not available.
New York-Northern New Jersey CPI monthly and annual percent changes
(not seasonally adjusted)
| 2003 | 2004 | 2005 | 2006 | 2007 | 2008
Month | Mo | Ann | Mo | Ann | Mo | Ann | Mo | Ann | Mo | Ann | Mo | Ann
January 0.8 3.3 0.3 2.7 0.6 4.1 0.8 3.7 0.2 2.7 0.2 3.7
February 0.8 3.3 0.6 2.5 0.4 3.9 0.2 3.6 0.6 3.1 0.5 3.6
March 0.5 3.1 1.1 3.2 1.7 4.4 0.8 2.7 0.7 2.9 0.9 3.8
April -0.2 2.6 0.3 3.7 0.0 4.2 0.9 3.6 0.5 2.5 0.3 3.6
May 0.1 2.8 0.2 3.9 -0.5 3.4 0.6 4.8 0.6 2.5 1.0 4.0
June 0.1 2.8 0.8 4.6 -0.3 2.3 0.5 5.6 0.5 2.5
July 0.4 3.0 -0.2 3.9 0.9 3.4 0.2 5.0 0.2 2.5
August 0.7 3.1 0.1 3.3 0.8 4.1 0.4 4.7 -0.1 1.9
September 0.3 3.3 0.1 3.2 0.8 4.8 -0.5 3.3 0.0 2.4
October 0.2 3.3 0.7 3.7 0.4 4.5 -0.5 2.4 0.1 3.1
November -0.3 3.1 0.0 3.9 -0.6 3.9 -0.4 2.6 0.4 3.9
December -0.1 3.2 -0.2 3.8 -0.5 3.6 0.2 3.3 0.0 3.7
The transportation index advanced 4.2 percent over the month,
largely reflecting the jump in gasoline prices. The May index also
reflected higher prices for motor fuels other than gasoline and for
air transportation. Over the year, transportation prices increased
9.6 percent, the largest 12-month advance since September 2005.
The housing index increased 0.4 percent in May, following a 0.2-
percent decline in April. The fuels and utilities component advanced
3.1 percent, largely due to the increases in natural gas and
residential fuel oil. The household furnishings and operations
component rose 0.8 percent over the month. Shelter prices, however,
were unchanged during May, after falling 0.4 percent in April. A
decline in charges for out-of-town lodging offset increases of 0.3
percent for owners' equivalent rent and 0.2 percent for residential
rent.
Among other expenditure categories, the medical care index
increased 1.1 percent. The apparel index registered a 0.9-percent
upturn in May, but was down 4.0 percent over the year. The education
and communication index rose 0.4 percent over the month, boosted by
higher long distance telephone charges. The other goods and services
index increased 0.5 percent, with higher cigarette prices, and the
recreation index inched up 0.1 percent.
With the New York-Northern New Jersey Consumer Price Index for All
Urban Consumers at 236.151 in May (1982-84=100), $23.62 was required
to purchase what $10 could in the 1982-84 base period. The
purchasing power of the dollar was 42.3 cents in 1982-84 dollars and
14.6 cents in 1967 dollars. In May, the Consumer Price Index for
Urban Wage Earners and Clerical Workers (CPI-W) was 230.923, up 1.2
percent over the month. The CPI-W rose 4.3 percent over the year.
On a 1967 base, the May CPI-W was 657.496.
Data in this report are not seasonally adjusted. Accordingly,
month-to-month changes may reflect the impact of seasonal influences.
The New York-Northern New Jersey-Long Island, NY-NJ-CT-PA
consolidated area comprises the five boroughs of New York City,
Nassau, Suffolk, Westchester, Rockland, Putnam, Dutchess, and Orange
Counties in New York State; Bergen, Essex, Hudson, Hunterdon, Mercer,
Monmouth, Middlesex, Morris, Ocean, Passaic, Somerset, Sussex, Union
and Warren Counties in New Jersey; Fairfield County and parts of
Litchfield, New Haven and Middlesex Counties in Connecticut; and Pike
County in Pennsylvania.
NYLS - 7334 Labor - New York
06/12/08
Consumer Price Index for All Urban Consumers (CPI-U): Indexes and percent changes for selected periods
New York-Northern N.J.-Long Island, NY-NJ-CT-PA (1982-84=100 unless otherwise noted)
Indexes Percent change from-
Item and Group
Mar. Apr. May May Mar. Apr.
2008 2008 2008 2007 2008 2008
Expenditure category
All items........... 233.122 233.822 236.151 4.0 1.3 1.0
All items (1967=100) 673.924 675.948 682.680 - - -
Food and beverages 217.953 220.009 221.159 5.5 1.5 .5
Food.............. 216.948 219.236 220.416 5.7 1.6 .5
Food at home..... 215.803 218.925 220.396 5.9 2.1 .7
Food away from
home......... 224.132 225.469 226.328 5.5 1.0 .4
Alcoholic
beverages..... 228.860 227.398 228.074 3.7 -.3 .3
Housing............ 252.586 252.200 253.161 3.2 .2 .4
Shelter........... 304.244 303.015 303.001 2.6 -.4 .0
Rent of primary
residence 1/ 290.943 291.938 292.639 4.5 .6 .2
Owners'
equivalent
rent of
primary
residence 1/
2/ ......... 308.414 309.225 310.265 3.1 .6 .3
Fuels and
utilities..... 197.303 201.039 207.321 12.3 5.1 3.1
Household energy 199.579 203.684 210.660 13.2 5.6 3.4
Gas (piped) and
electricity
1/......... 186.483 189.437 194.648 5.5 4.4 2.8
Electricity 1/ 165.808 169.629 171.415 3.1 3.4 1.1
Utility (piped)
gas service
1/........ 226.907 227.722 240.687 9.3 6.1 5.7
Household
furnishings
and operations 127.754 127.503 128.486 -2.0 .6 .8
Apparel............ 112.728 111.844 112.882 -4.0 .1 .9
Transportation..... 200.012 203.058 211.635 9.6 5.8 4.2
Private
transportation 189.936 193.421 202.221 9.8 6.5 4.5
Motor fuel....... 247.212 261.591 294.561 25.7 19.2 12.6
Gasoline (all
types)...... 245.733 259.935 292.904 25.5 19.2 12.7
Gasoline,
unleaded
regular 3/ 249.334 264.346 298.627 26.0 19.8 13.0
Gasoline,
unleaded
midgrade
3/ 4/.... 244.449 257.141 288.883 24.7 18.2 12.3
Gasoline,
unleaded
premium 3/ 241.152 254.028 284.199 24.4 17.9 11.9
Medical care....... 366.596 365.956 369.871 2.8 .9 1.1
Recreation 5/..... 113.542 114.919 115.043 .4 1.3 .1
Education and
communication
5/............ 127.688 127.836 128.332 3.8 .5 .4
Other goods and
services....... 341.966 341.909 343.477 2.3 .4 .5
Commodity and service group
All items........... 233.122 233.822 236.151 4.0 1.3 1.0
Commodities........ 178.566 180.466 183.881 5.4 3.0 1.9
Commodities less
food and
beverages..... 150.731 152.462 156.802 5.2 4.0 2.8
Nondurables less
food and
beverages.... 183.522 186.936 195.282 9.1 6.4 4.5
Durables......... 108.113 107.876 107.527 -2.0 -.5 -.3
Services........... 279.870 279.574 281.010 3.2 0.4 0.5
Special aggregate indexes
All items less
medical care.... 227.055 227.793 230.053 4.0 1.3 1.0
All items less
shelter......... 205.228 206.779 210.162 4.8 2.4 1.6
Commodities less
food............ 154.042 155.690 159.952 5.2 3.8 2.7
Nondurables......... 202.929 205.745 210.771 7.4 3.9 2.4
Nondurables less
food............ 186.564 189.731 197.699 8.8 6.0 4.2
Services less rent
of shelter 2/ 262.143 263.044 266.407 4.0 1.6 1.3
Services less
medical care
services........ 272.565 272.280 273.482 3.2 .3 .4
Energy.............. 220.181 228.579 246.402 19.2 11.9 7.8
All items less
energy.......... 236.006 235.958 236.787 2.6 .3 .4
All items less food
and energy..... 240.980 240.489 241.256 2.1 .1 .3
1/ This index series was calculated using a Laspeyres estimator. All other item
stratum index series were calculated using a geometric means estimator.
2/ Index is on a December 1982=100 base.
3/ Special index based on a substantially smaller sample.
4/ Indexes on a December 1993=100 base.
5/ Indexes on a December 1997=100 base.
- Data not available.
Last Modified Date: July 16, 2008
Quick Links
Tools
|
Calculators
|
Help
|
Info
|
|