 |
 |
|||||||
NEW RESIDENTIAL SALESTable of ContentsI. PurposeII. Definitions III. Source of Data and Survey Questionnaire VI. Compilation of Data
VII. Reliability of
Data
VIII. Seasonal Adjustment I. PURPOSEThe purpose of the New Residential Sales press release is to provide statistics on the sales of new privately-owned single-family residential structures in the United States. Data included in the press release are (1) the number of new single-family houses sold; (2) the number of new single-family houses for sale; and (3) the median and average sales prices of new homes sold. Excluded from these estimates are "HUD-code" manufactured (mobile) home units.II. DEFINITIONSNew Residential SalesNew residential sales estimates only include new single-family residential structures. Sales of multi-family units are excluded from these statistics. To be included in the sales estimates the sales transaction must intend to include both the house and the land. All new houses are not included in our new residential sales estimates, only houses sold prior to being built or built for sale are included in these statistics. Excluded from these estimates are houses built for rent, houses built by the owner, and houses built by a general contractor on the owner's land.New Houses SoldA house is considered sold when either a sales contract has been signed or a deposit accepted. Included in our estimates are houses for which a sales contract is signed or deposit accepted before construction has actually started; for instance, houses sold from a model or from plans before any work has started on the footings or foundations. These estimates also include houses sold while under construction or after completion. This survey does not follow through to the completion ("closing") of the sales transaction, so even if the transaction is not finalized, the house is still considered sold.New Houses For SaleA house is considered for sale when a permit to build has been issued in permit-issuing places or work has begun on the footings or foundation in nonpermit areas and a sales contract has not been signed nor a deposit accepted.Months' SupplyThe months' supply is the ratio of houses for sale to houses sold. This statistic provides an indication of the size of the for sale inventory in relation to the number of houses currently being sold. The months' supply indicates how long the current for sale inventory would last given the current sales rate if no additional new houses were built.Sales PriceThe sales price used in the survey is the price agreed upon between purchaser and seller at the time the first sales contract is signed or deposit made. It includes the price of the improved lot. The sales price does not reflect any subsequent price changes resulting from change orders or from any other factors affecting the price of the house. Furthermore, the sales price does not include the cost of any extras or options paid for in cash by the purchaser or otherwise not included in the original sales price reported.The median sales price is the sales price of the house which falls on the middle point of the total number of houses sold. Half of the houses sold have a sales price less than the median and half have a greater price. A full write up of the methodology used for medians can be found here. The average, or arithmetic mean, sales price is obtained by dividing the sum of all the sales prices reported by the number of houses reporting a sales price. Median Months For SaleThe median number of months for sale is the median number of months from the month of completion to the current month. Houses sold prior to completion are excluded from the statistics for the median number of months for sale. A full write up of the methodology used for medians can be found here.Housing UnitA housing unit, as defined for purposes of this report, is a house intended for occupancy as separate living quarters. Housing units, as distinguished from "HUD-code" manufactured (mobile) homes, include conventional ``site-built'' units, prefabricated, panelized, componentized, sectional, and modular units. Housing unit statistics in these tables exclude group quarters (such as rooming houses), transient accommodations (such as tourist courts), "HUD-code" manufactured (mobile) homes, moved or relocated units, and housing units created in an existing residential or nonresidential structure.Attached and Detached Housing UnitsThe single-family statistics include fully detached, semidetached (semiattached, side-by-side), rowhouses, and townhouses. In the case of attached units, each must be separated from the adjacent unit by a ground-to-roof wall in order to be classified as a one-unit structure. Also, these units must not share heating/air-conditioning systems or interstructural public utilities, such as water supply, power supply, or sewage disposal lines. Units built one on top of another and those built side-by-side which do not have a ground-to-roof wall and/or have common facilities (i.e., attic, basement, heating plant, plumbing, etc.) are not included in these statistics."HUD-code" Manufactured (mobile) HomesA manufactured home is defined as a movable dwelling, 8 feet or more wide and 40 feet or more long, designed to be towed on its own chassis, with transportation gear integral to the unit when it leaves the factory, and without need of a permanent foundation. These homes are built in accordance with the U.S. Department of Housing and Urban Development (HUD) building code. Since these units are typically not covered by the building permits issued in local municipalities, they are excluded from the New Residential Sales statistics.Type of FinancingThe type of financing tabulated in this survey is the type reported at the time the original sales agreement was signed or deposit accepted. However, changes in the type of financing do occur between the original contract signing and final settlement. These changes are not reflected in the tables. For contractor-built and owner-built houses the type of financing is that reported at time of completion.The FHA and VA type-of-financing data presented in this report tend to differ from those published directly by those agencies. For the actual number of FHA-insured and VA-guaranteed loans made for new houses at the time of final settlement, refer to the publications of the respective agencies. The data differ because of the difference in time periods between the signing of the original sales contract, the start of construction, and the insurance or guarantee of the mortgage, as well as the sampling variability in this survey. Early in 1995, the Farmers Home Administration was
reorganized. As part
of this reorganization the Rural Housing Service now handles the
mortgage
functions formerly done by the Farmers Home Administration.
RegionsThe standard census geographic regions are used in the tables of this report. Click here to see a map (in PDF format) showing the regional boundaries. States contained in each region are as follows:
III. SOURCE OF DATAEstimates of new single-family houses sold and for sale are obtained from the Survey of Construction (SOC). SOC is comprised of two parts: (1) Survey of Use of Permits (SUP) which estimates the amount of new home sales in areas that require a building permit and (2) Nonpermit Survey (NP) which estimates the amount of new home sales in areas that do not require a building permit. Less than 1 percent of all new single-family home sales take place in nonpermit areas. Data from both parts of SOC are collected by Census field representatives. For SUP they visit a sample of permit offices and select a sample of permits issued for new housing. These permits are then followed through to see when they are started, completed and sold if the one-family unit was built to be sold. Each project is also surveyed to collect information on characteristics of the structure. For NP, roads in sampled nonpermit land areas are driven at least once every three months to see if there is any new construction. Once new residential construction is found, it is followed up the same as in SUP.The Census field representatives use interviewing software on
laptop
computers to collect the data. Facsimiles of the computer-based
questionnaires
are provided to respondents to familiarize them with the survey. These
facsimiles show the questions that are asked for housing units in
single-family
buildings
Form SOC-QI/SF.1 and in
multiunit buildings
Form SOC-QI/MF.1.
IV. GEOGRAPHIC COVERAGEAll statistics in the New Residential Sales release are tabulated only for the United States and four Census Regions. The SOC does not have a large enough sample size to make state or local area estimates.For more geographic information, please refer to our
definitions of
Regions.
V. SAMPLE DESIGNHousing Units Authorized, but Not Started; Housing Starts; Housing Units Under Construction; Housing Completions; Housing Sales; and Characteristics of New HousingV.a Sample design beginning January 2005 is as follows:The Survey of Construction sample design consists of three stages: (1) a subsample of the 2004 Current Population Survey (CPS) primary sampling units (PSUs) - CPS PSUs are land areas (groups of counties, towns or townships within a state) that represent the entire United States; (2) selection of permit/non-permit areas; and (3) selection of permits. In the first stage, the 820 CPS primary sampling units were classified as self representing or non- self representing. If a PSU had a large population age 16 and over, or high permit activity, it was classified as self-representing; otherwise it was classified as non self-representing. There were 48 self-representing PSUs. The 772 non-self representing PSUs were grouped into 121 strata by Census division, permit activity, metropolitan status and population (non-institutional population age 16 and over based on the 2000 Census). One non-self representing PSU was selected per stratum using a procedure that maximized the overlap between the old and new sample of PSUs. Within the 169 strata, the second stage of sampling was performed separately for permit-issuing places and areas that do not need a permit to build, referred to as non-permit. The permit-issuing places were stratified by permit activity. Approximately 900 permit-issuing places were selected. The selection of the non-permit areas was based on the 2000 Census geography tract and block definitions. Within each state the land area was divided into blocks, which are components of tracts. Blocks were classified as permit and non-permit. The non-permit blocks were combined at the tract level, and these areas were stratified by Census 2000 housing unit population. Higher population areas had greater probabilities of selection. Approximately 80 areas were selected. The third stage of selection is performed monthly in the approximately 900 permit-issuing places and 80 non-permit areas. In permit-issuing places , field representatives list and select a sample of permits. Permits for the one to four unit buildings are sampled at an overall rate of 1 in 50. All permits for buildings with five or more units are included in the sample, except for rare cases where the workload for a field representative is excessive. If this occurs, a random sample of permits for the buildings with five or more units is taken. In non-permit areas, field representatives canvass the areas looking for housing units started, all of which are included in the sample. V.b Sample design for 2004 and earlier is as follows: Within each of these 169 areas, the sample was selected from two different sample frames: permit-issuing places and land areas not covered by building permit systems. Each permit-issuing place was assigned to one of six size classes based on a weighted average of 1978, 1981, and 1982 permit activity. The two most recent years available for the SOC redesign, 1981 and 1982, were unusual because of recession. Future activity was expected to return toward the pre-recession distribution. It was thought that averaging 1981 and 1982 with 1978 would include this tendency to return to the pre-recession distribution but also reflect a permanent change in the distribution of activity due to the changes in the economy. The activity levels were standardized by dividing by the US activity for each year because the activity levels were quite different in the three years. The permit places in each of the 169 areas were grouped into these six size classes and a systematic sample of places was selected from each size class. Places were selected at different sampling rates in each of the classes so that larger proportions of the places were selected from the larger size classes. For example, all places in the largest size classes fell into sample, but only an expected 1 in 40 of the places in the smallest size class fell into sample. Approximately 840 permit-issuing places were selected. Due to splits and mergers of local permit systems, there are now about 900 permit offices in the Survey of Construction. Monthly, Census field representatives sample permits from these 900 permit-issuing places. They select permits for one-to-four-unit buildings with probability proportional to the number of units at an overall rate of 1 in 40. All permits for buildings with five units or more are selected. Within each of the 169 areas, the land not covered by building permit systems, called nonpermit areas, was identified. Small land areas (1980 Census enumeration districts) in these nonpermit areas were grouped into two strata according to the 1980 population. Overall, 1 out of every 120 land areas was selected from the strata with the larger areas and 1 out of 600 was selected from the strata with the smaller areas. Monthly, census field representatives canvassed about 130 selected land areas looking for all housing units started. In January 1995, the area covered by building permit systems
was expanded
to 19,000 permit-issuing places. Canvassing was stopped in those
selected
land areas now represented by permit-issuing places. Census field
representatives
continue to canvass about 70 land areas still not covered by building
permit
systems. Due to the small amount of new construction activity, many
areas
are now only canvassed once every three months.
Effective with the January 2005 data release, the Survey of Construction implemented a new sample of building permit offices from which sampled houses are selected. The sample of permit offices was redesigned to reflect the location of building permit activity in the past few years, replacing the previous sample selected in 1985. The selection of the approximately 900 permit offices in the new sample was designed to optimize the precision of the housing starts estimates. No attempt was made to select offices representing geographic areas with similar housing prices and characteristics as the old sample. As a result, data users should use caution when analyzing year over year changes in housing prices and characteristics between 2004 and 2005. It may be possible, for example, that many jurisdictions in the 1985 sample are more built up now, remaining land may be more expensive, remaining lots may be smaller, etc. These jurisdictions may have been replaced in the new sample with more outlying areas that are now actively issuing building permits. In these locations land may be more abundant, lot sizes might be larger, and sales prices possibly lower. It is important to note that estimates from the old and new samples are both statistically correct. The actual values that we are trying to estimate fall within intervals that can be calculated from the sample data with known probabilities. For example, when we publish an estimate with a relative standard error (RSE) of 5%, there is a 90% chance that the true value is within "8% (statistically defined as 1.6 times the RSE) of the estimate. VI. COMPILATION OF DATAEffective in April 2001, with revisions back to January 1999, changes were made to the methodology used to generate these estimates. The methodology used is described below. For a full explanation of the changes and an estimate of the effect on the estimates, click here.VI.a. Methodology Used for Data Through 1998New Home Sales:The compilation of the new home sales series was a multistage process. First, an estimate was made monthly of the number of housing units for which building permits were issued in all 19,000 permit-issuing places as described above. Second, for each permit selected in the 900 permit-issuing places, an inquiry was made of the owner or the builder to determine if the house was already sold or was for sale. If already sold, the month and year the house covered by the permit was sold was obtained. In case the house authorized by a permit in a particular month was for sale, follow-ups were made in successive months to find out when the unit was actually sold. Ratios were calculated of the number of houses sold to the number of houses covered by permits based on estimates generated from the 900 SOC permit offices. Separate ratios were calculated for houses sold from permits of that month and of each preceding month for the past 7 years. These ratios, or sales rates, were then applied to the appropriate estimate of the number of houses authorized by permits, based on the Building Permits Survey, in the corresponding months to provide estimates of the number of houses sold for each month of authorization. Having produced estimates of the number of houses sold with permit authorization, two additional adjustments were made. An upward adjustment of 3.3 percent was made to the number of houses started to account for those units started within permit-issuing areas but without permit authorization. (A study spanning a four year period during the mid 1960s indicated that permits were obtained for all buildings with two housing units or more.) The estimates for housing units sold in the 19,000 permit-issuing places resulted from the procedures outlined above. Third, units identified as sold in the monthly canvass of nonpermit areas were weighted appropriately to provide an estimate of total houses sold in areas not covered by building permit systems. Adding this estimate of houses sold in nonpermit areas to the estimate of houses sold in the 19,000 permit-issuing places resulted in an estimate of total private houses sold. Adjustments are made to account for those houses sold prior to permit authorization and for late reports. These adjustments are applied by stage of construction based on historical patterns of pre-permit sales and late reports. An outlier procedure is used to adjust for extreme values in the history. No adjustment is made for units in permit areas built without a permit. This same methodology was also used for the estimates of houses for sale. The procedure described above was done by region. Eight sets of sales rates were used: separate sets of rates for metropolitan and nonmetropolitan areas within each of the four regions. VI.b. Methodology Used Beginning With 1999 DataNew Home Sales:The compilation of the new home sales series is a multistage process. First, an estimate is made monthly of the number of housing units for which building permits are issued in all 19,000 permit-issuing places as described above. Second, for each permit selected in the 900 permit-issuing places, an inquiry is made of the owner or the builder to determine if the house was already sold or is for sale. If already sold, the month and year the house covered by the permit was sold is obtained. In case the unit authorized by a permit in a particular month is for sale, follow-ups are made in successive months to find out when the unit is actually sold. Ratios are calculated (by type of structure) of the number of units authorized by permits, based on the Building Permits Survey to the number of units authorized by permits based on estimates generated from the 900 SOC permit offices; separate ratios are calculated for that month and the prior 11 months. The 13th through 18th month back are summed and a ratio is calculated and all months from 19 months back through 60 months (5 years) are summed to get another ratio. These ratios are then applied to the appropriate estimate of the number of houses sold, based on the 900 SOC permit offices, in the corresponding months or groups of months to provide ratio adjusted estimates of the number of houses sold for each month or group of months. Adjustments are made to account for those houses sold prior to permit authorization and for late reports. These adjustments are based on historical patterns of pre-permit sales and late data. No adjustment is made for units in permit areas built without a permit. The estimates for houses sold in the 19,000 permit-issuing places result from the procedures outlined above. Third, houses identified as sold in the monthly canvass of nonpermit areas are weighted appropriately to provide an estimate of total houses sold in areas not covered by building permit systems. Adding this estimate of sales in nonpermit areas to the estimate of sales in the 19,000 permit-issuing places results in an estimate of total private houses sold. This same methodology is also used for the estimates of houses for sale. The procedure described above is done by region. Four sets of sales rates are used: separate sets of rates within each of the four regions. VI.c. Adjustments for Non-Reporting of CharacteristicsInformation on selected characteristics, such as the sales price, are not reported by every case in our sample. Cases for which characteristics are not reported have been distributed proportionally to those for which the characteristic was reported.VII. RELIABILITY OF DATAThese estimates are based on sample surveys and may differ from statistics which would have been obtained from a complete census using the same schedules and procedures. An estimate based on a sample survey is subject to both sampling error and non-sampling error. The accuracy of a survey result is determined by the joint effects of these errors.VII.a. Sampling ErrorsSampling error reflects the fact that only a particular sample was surveyed rather than the entire population. Each sample selected for the Survey of Construction is one of a large number of similar probability samples that, by chance, might have been selected under the same specifications. Estimates derived from the different samples would probably differ from each other. The standard error, or sampling error, of a survey estimate is a measure of the variation among the estimates from all possible samples and, thus, is a measure of the precision with which an estimate from a particular sample approximates the average from all possible samples.Estimates of the standard errors have been computed from the sample data for selected statistics in this report. They are presented in the tables in the form of average relative standard errors. The relative standard error equals the standard error divided by the estimated value to which it refers. The sample estimate and an estimate of its standard error allow us to construct interval estimates with prescribed confidence that the interval includes the average result of all possible samples with the same size and design. For example, suppose the New Home Sales table showed that an estimated 70,000 houses were sold in a particular month. Further, suppose that the average relative standard error of this estimate is 3 percent. Multiplying 70,000 by 0.03, we obtain 2,100 as the standard error. This means that we are confident, with 2 chances out of 3 of being correct, that the average estimate from all possible samples of houses sold during the particular month is between 67,900 and 72,100 houses. To increase the probability to about 9 chances out of 10 that the interval contains the average value over all possible samples (this is called a 90-percent confidence interval), multiply 2,100 by 1.6, yielding limits of 66,640 and 73,360 (70,000 houses plus or minus 3,360 houses). The average estimate of houses sold during the specified month may or may not be contained in any one of these computed intervals; but for a particular sample, one can say that the average estimate from all possible samples is included in the constructed interval with a specified confidence of 90 percent. Ranges of 90-percent confidence intervals for estimated
percent changes
are shown in the text. When the range of the confidence interval
contains
zero, it is unclear whether there was an increase or decrease; that is,
the change is not statistically significant.
VII.b. Non-sampling ErrorsAs calculated for these estimates, the relative standard error estimates sampling variation but does not measure all non-sampling error in the data. Non-sampling error consists of both a variance component and a bias component. Bias is the difference, averaged over all possible samples of the same size and design, between the estimate and the true value being estimated. Non-sampling errors are usually attributed to many possible sources: (1) coverage error - failure to accurately represent all population units in the sample, (2) inability to obtain information about all sample cases, (3) response errors, possibly due to definitional difficulties or misreporting, (4) mistakes in recording or coding the data obtained, and (5) other errors of coverage, collection and nonresponse, response, processing, or imputing for missing or inconsistent data. These non- sampling errors also occur in complete censuses. Although no direct measures of these errors have been obtained, precautionary steps have been taken in all phases of the collection, processing, and tabulation of the data to minimize their influence.As described in the section, ``Methodology Used for Data through 1998,'' a potential source of bias prior to 1999 was the upward adjustment of 3.3 percent made to account for houses sold in permit-issuing areas without permit authorization. Another source is the adjustment for houses sold prior to
permit authorization
and for late reports. The preliminary estimates of privately owned
houses
sold are adjusted upward about 40 percent; the final estimates about 5
percent.
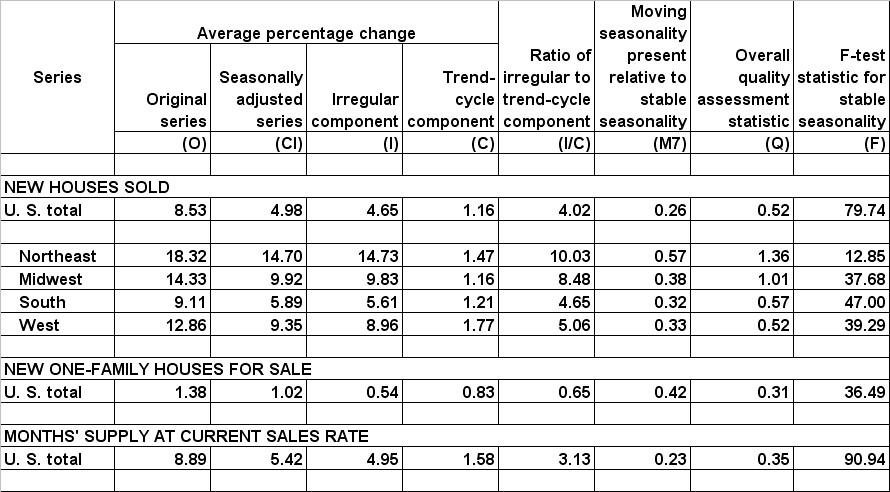
VIII. SEASONAL ADJUSTMENTSeasonal adjustment is the process of estimating and removing seasonal effects from a time series to better reveal certain non-seasonal features such as underlying trends and business cycles. Seasonal adjustment procedures estimate effects that occur in the same calendar month with similar magnitude and direction from year-to- year. In series whose seasonal effects come primarily from weather the seasonal factors are estimates of average weather effects for each month. Seasonal adjustment does not account for abnormal weather conditions or for year-to-year changes in weather. Seasonal factors are estimates based on present and past experience. Future data may show a different pattern.The mechanics of seasonal adjustment involve breaking down a time series into 'trend-cycle' and 'seasonal and irregular' components. The trend-cycle is the long-term tendency of a series to grow or decline. Seasonal effects are effects that are reasonably stable in terms of timing, direction and magnitude. Possible causes include natural factors (the weather), administrative measures and social/cultural/religious traditions. The irregular component is anything not included in the trend-cycle or the seasonal effects (including trading-day or holiday effects). Its values are unpredictable with respect to timing, impact, and duration. It can arise from sampling error, non-sampling error, unseasonable weather, natural disasters, strikes, etc. Monthly time series that are totals of daily activities can be influenced by each calendar month's weekday composition. This influence is revealed when monthly values consistently depend on which days of the week occur five times in the month. For example, building permit offices are usually closed on Saturday and Sunday. Thus, the number of building permits issued in a given month is likely to be higher if the month contains a surplus of weekdays and lower if the month contains a surplus of weekend days. Recurring effects associated with individual days of the week are called trading-day effects. Trading-day effects can make it difficult to compare time series values or to compare movements in one series with movements in another. For this reason, when estimates of trading-day effects are statistically significant, we adjust them out of the series. The removal of such estimates is referred to as trading-day adjustment. The new homes sold seasonally adjusted series is shown as seasonally adjusted annual rates (SAAR). The seasonally adjusted annual rate is the seasonally adjusted monthly value multiplied by 12. The benefit of the annual rate is that not only can we compare one monthly estimate with another, we can also compare monthly data to an annual total. The seasonally adjusted annual rate is neither a forecast nor a projection; rather it is a description of the rate of new home sales in the particular month for which they are calculated. The seasonal adjustment factors shown in this publication were developed using X-12-ARIMA. The X-12-ARIMA is a seasonal adjustment program developed at the U.S. Census Bureau. The program is based on the Bureau's earlier X-11 program and the X-11-ARIMA/88 program developed at Statistics Canada. For more information on X-12-ARIMA please see the Bureau's X-12 website. The procedures used to develop seasonal adjustments for monthly New Residential Sales are described below. New Houses Sold The seasonally adjusted annual rates are developed each month for single-family houses sold by region. Each month the four regional series are run through the X-12-ARIMA program. The seasonally adjusted U.S. total is the sum of the four seasonally adjusted components. New One-Family Houses For Sale and Months' Supply at Current Sales Rate The seasonally adjusted number of New One-Family Houses For Sale and Months' Supply at Current Sales Rate are developed at the national level. Each month the U.S. value for each series is run through the X-12-ARIMA program. The X-12-Arima program that we use to derive our seasonal adjustment calculates numerous diagnostic statistics. The table below shows some of these statistics. For a description of the diagnostics published in this table, please click here. Average Percent Changes and Related Measures for Monthly New Residential Sales
For further information on time series and seasonal adjustment, please refer to the Seasonal Adjustment Frequently Asked Questions.
Source: U.S. Census Bureau
Census Bureau Links: Home
· Search
· Subjects A-Z
· FAQs
· Data Tools
· Catalog
· Census 2000
· Quality
· Privacy Policy
· Contact Us
Page Last Modified: February 05, 2008
|
 For further information, contact the
Residential Construction Branch at 301-763-5160.
For further information, contact the
Residential Construction Branch at 301-763-5160.