CB05-FF.11-2 (Rev.)
August 15, 2005
PDF Version
- 113K |
| |
|
|
|
|
|
|
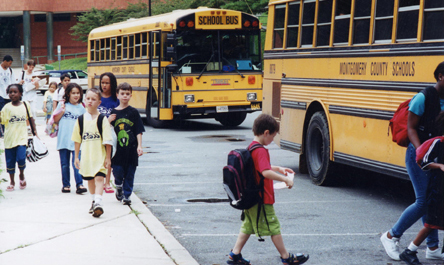
Back to School
The sight of crossing guards and bright yellow buses mean the “dog
days of summer” and the traditional summer break have come to a
close — our nation’s schools have reopened! This edition of
Facts for Features highlights the many interesting statistics
evolving from students and teachers returning to the classrooms. |
| 
Students
74.9 million
The
number of people enrolled in school throughout the country — from
nursery school to college. That amounts to more than one-fourth of the U.S.
population age 3 and older. 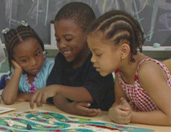
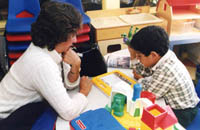
Pre-K through 12
Enrollment
About 60%
Percentage
of 3- and 4-year-olds enrolled in nursery school, up from about 6 percent
in 1964, when these data were first collected. |
Back-to-School Shopping
$6.0 billion
The amount of money spent
at family clothing stores in August 2004. Only in October, November
and December — the holiday shopping season — were sales higher.
Similarly, bookstore sales in August 2004 totaled $2.0 billion, an amount
equaled in 2004 only by sales in December and January. (The dollar volume
estimates have not been adjusted for seasonal variations, holiday or trading
day differences or price changes.)
If you’re not sure where to do your back-to-school shopping, choices
of retail establishments
abound: In 2003, there were 24,065 family clothing stores; 6,457 children
and infants clothing stores; 27,352 shoe stores; 8,840 office supplies
and stationery stores; 22,410 sporting goods stores; 11,036 bookstores
and 9,366 department stores. |
| 65%
Percentage
of children enrolled in kindergarten who attend all day, up from 20
percent three decades earlier.
54.6 million
The projected number
of students to be enrolled in the nation’s elementary and high schools
(grades K-12) this fall [PDF]. That number exceeds the 1970 total
of 51.3 million, when virtually all of these students were “baby
boomers,” who swelled school enrollments.
|
Languages
9.9 million
Number
of school-age children (5 to 17) who speak a language other than English
at home. These children make up nearly 1-in-5 in this age group. Most
of them (7.0 million) speak Spanish at home. |
| 381,000
The
national decrease in elementary school-age children between 2003 and 2004.
Only six states experienced an increase in this population during that
period: Arizona, Nevada, Florida, North Carolina, Colorado and Georgia.
329,000
The
increase in the nation’s high school-age population between 2003
and 2004. More than two-thirds of the states experienced an increase
in this group over that period, led by California (78,000), Florida (33,000)
and New York (24,000).
12%
Projected percentage of elementary and high
school students enrolled in private schools this fall [PDF].
40%
Percentage of elementary
and high school students who are minorities (i.e., people who are
other than non-Hispanic white). This compares with 21 percent in 1970,
when the crest of the baby boom was enrolled at this level of school. |
Lunchtime
29.0 million
Average number of children participating each month in the national school
lunch program. (From the upcoming Statistical Abstract of the United
States: 2006.)
10.1 billion
The nation’s total apple production,
in pounds, in 2004. The chances are good that the apples your children
present to their teachers or enjoy for lunch were grown in Washington
state, which accounted for more than half of the nation’s total
production. |
|  22% 22%
Percentage of elementary and high school students
with at least one foreign-born parent. This includes 6 percent who
were foreign-born themselves.
|
Technology
in the Schools
14.1 million
Number of computers available for classroom
use in the nation’s 114,000 elementary and secondary schools [PDF];
that works out to one computer for every four students. |
 College College
64%
Percentage
of the 2003 high school graduating class that went directly to college.
16.7 million
The projected number of students enrolled
in the nation’s colleges and universities this fall [PDF]. This
is up from 12.1 million a quarter-century ago.
37%
Percentage
of all college students age 25 and over. The majority of these older
students (56 percent) attend school part-time.
1-in-3
Ratio
of undergraduates attending two-year institutions. |
The Rising Cost of
College
$10,660
Average tuition, room and board (for in-state
students) at the nation’s four-year public colleges and universities
for an entire academic year [PDF]; that is double the corresponding
figure in 1990.
$31,051
Average tuition, room and board at the nation’s
four-year private colleges and universities for one complete academic
year [PDF]; that is more than double the corresponding 1990 figure.
|
|
Graduation
3.1 million
Projected number of high school diplomas that
will be awarded this school year [PDF].
2.7 million
Number of college degrees expected to be conferred
this school year [PDF]. |
The Rewards of Staying
in School
$74,602
Average
annual earnings of workers age 18 and over with an advanced degree.
This compares with $51,206 a year for those with bachelor’s degrees,
$27,915 for those with a high school diploma only and $18,734 for those
without a high school diploma.
$55,987
Average starting salary offered to bachelor’s
degree candidates in petroleum engineering [PDF], among the highest
of any field of study. At the other end of the spectrum were those majoring
in the social sciences; they were offered an average of $29,098. |
Government Spending on
Education
$8,019
The
per-pupil expenditure on elementary and secondary education nationally in
2003. The District of Columbia ($13,328) spent the most among states
or state-equivalents, followed by New Jersey ($12,202), New York ($12,140),
Connecticut ($10,372) and Vermont ($10,322). |
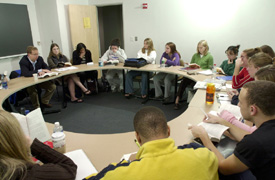
 Teachers
and Other School Personnel Teachers
and Other School Personnel
6.5 million
Number of teachers in the United States
[PDF]. The bulk of them (2.6 million) teach at the elementary and middle
school level.
$56,300
Average annual salary of public elementary
and secondary school teachers in California as of the 2002-2003 school
year [PDF]— highest of any state in the nation. Teachers in
South Dakota received the lowest pay — $32,400. The national average
was $45,900.
$13.85
Average hourly wage for the nation’s
school bus drivers [PDF]. Custodians earned $12.40 while cafeteria
workers made $9.98. (The federal minimum wage is $5.15.) |
| Following is a list
of observances typically covered by the Census Bureau Facts
for Features series: |
- Martin Luther King, Jr. Day (Jan. 17) &
African-American History Month (February)
- Valentine's Day (Feb. 14)
- Women's History Month (March)
- St. Patrick's Day (March 17)
- Asian Pacific American Heritage Month (May)
- Older Americans Month (May)
- Mother's Day (May 8)
- Father's Day (June 19)
- The Fourth of July (July 4)
- Anniversary of Americans with Disabilities
Act (July 26)
|
- Back to School (August)
- Labor Day (Sept. 5)
- Grandparents Day (Sept. 11)
- Hispanic Heritage Month (Sept. 15-Oct. 15)
- Halloween (Oct. 31)
- American Indian/Alaska Native Heritage
&nbMonth (November)
- Veterans Day (Nov. 11)
- Thanksgiving Day (Nov. 24)
- The Holiday Season (December)
|
| Individual source links for
each statement herein may be accessed on the Internet at
<http://www.census.gov/Press-Release/www/releases/archives/facts_for_features_special_editions/005225.html>.
The photos
herein may be downloaded and are available free for your use in all
print and broadcast products.
Please credit the U.S. Census Bureau. For product information, call (301)
763-3011 or e-mail <pio.broadcast.services@census.gov>.
Editor’s note: Some of the preceding data were
collected in surveys and, therefore, are subject to sampling error. Questions
or comments should be directed to the Census Bureau’s Public Information
Office at (301) 763-3030; fax (301) 457-3670; or e-mail <pio@census.gov>.
|