|
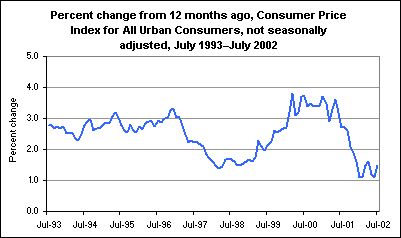
August 21, 2002 (The Editor’s Desk is updated each business day.) Consumer prices in JulyOn a seasonally adjusted basis, the Consumer Price Index for all Urban Consumers (CPI-U) increased 0.1 percent in July, the same as in June. The indexes for food and for energy each turned up in July, increasing 0.2 and 0.4 percent, respectively. The index for food at home—up 0.1 percent—recorded its first advance since March. Within energy, an increase of 1.2 percent in the index for petroleum-based energy was partially offset by a 0.4-percent decline in the index for energy services. Excluding food and energy, the CPI-U rose 0.2 percent after increasing 0.1 percent in June. An upturn in the index for communication, coupled with larger increases in the indexes for medical care and for shelter, more than offset a deceleration in the index for tobacco and smoking products. With the release of the July 2002 CPI, BLS introduced a new measure of consumer prices, the Chained Consumer Price Index for All Urban Consumers (C-CPI-U). In addition to the index for July 2002, monthly data for the C-CPI-U also have been issued for the period from December 1999 through June 2002. For more information, see "Note on a New, Supplemental Index of Consumer Price Change."  The July CPI-U level of 180.1 was 1.5 percent higher than its level in July 2001.  These data are a product of the BLS Consumer Price Index program.  Find out more in "Consumer Price Indexes, July 2002" (PDF) (TXT), news release USDL 02-480. Happy 10th Birthday, TED!The very first issue of The Editor's Desk (TED) was posted on September 28, 1998. TED was the first online-only publication of the Bureau of Labor Statistics. For 10 years, BLS has been committed to posting a new TED article each business day, for a total of over 2,400 articles so far. |
Tools |
Calculators |
Help |
Info |