|
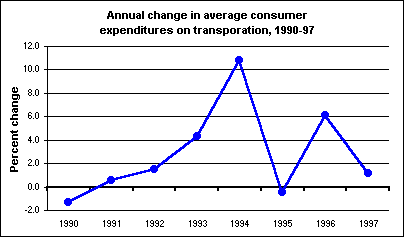
March 23, 1999 (The Editor’s Desk is updated each business day.) Transportation spending brakes in 1997After having risen by 6.1 percent the previous year, spending on transportation increased by only 1.2 percent in 1997. Consumer units spent an average of $6,457 for transportation-related expenditures during the year.
Vehicle purchases are the largest transportation component and accounted for 42 percent of transportation spending in 1997. During the year, spending on vehicle purchases dropped by 2.8 percent, after rising 6.7 percent in 1996. Vehicle purchases fluctuate widely from year to year because relatively small changes in the percentage of consumer units buying expensive, infrequently purchased vehicles have a large effect on the average. Spending on public transportation decreased 8.0 percent in 1997, following a 20.3-percent increase the previous year. Public transportation includes airline, ship, and train fares, as well as mass transit. While expenditures on vehicle purchases and public transportation fell in 1997, spending on "other vehicle expenses" and on gasoline and motor oil increased, by 8.4 percent and 1.5 percent respectively. Other vehicle expenses account for about a third of overall transportation costs and include vehicle finance charges, maintenance and repairs, vehicle insurance, and vehicle rentals and leasing. These data are a product of the BLS Consumer Expenditure Survey. Additional information is available from "Consumer Expenditures in 1997", Report 927. Happy 10th Birthday, TED!The very first issue of The Editor's Desk (TED) was posted on September 28, 1998. TED was the first online-only publication of the Bureau of Labor Statistics. For 10 years, BLS has been committed to posting a new TED article each business day, for a total of over 2,400 articles so far. |
Tools |
Calculators |
Help |
Info |