|
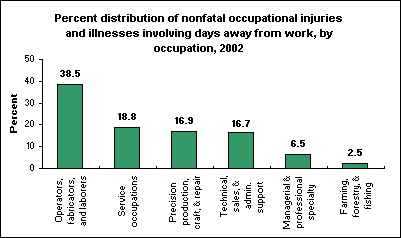
March 31, 2004 (The Editor’s Desk is updated each business day.) Occupations with most lost-time injuries and illnessesOperators, fabricators, and laborers experienced more on-the-job injuries and illnesses involving one day or more away from work than any other major occupational group (552,900 or 38.5 percent of all injuries) in 2002. Within the operators, fabricators, and laborers occupation group, 36 percent of lost-workday cases occurred in the manufacturing industry. Service workers accounted for the next largest share of workplace injuries and illnesses, at 18.8 percent of the total. Precision production, craft, and repair occupations and technical, sales, and administrative support occupations each experienced just under 17 percent. These data are from the BLS Injuries, Illnesses, and Fatalities program. Additional information is available from "Lost-worktime Injuries and Illnesses: Characteristics and Resulting Time Away From Work, 2002" (PDF) (TXT), news release USDL 04-460.
Related TED articles: Happy 10th Birthday, TED!The very first issue of The Editor's Desk (TED) was posted on September 28, 1998. TED was the first online-only publication of the Bureau of Labor Statistics. For 10 years, BLS has been committed to posting a new TED article each business day, for a total of over 2,400 articles so far. |
Tools |
Calculators |
Help |
Info |