|
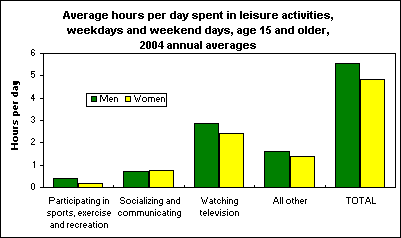
October 06, 2005 (The Editor’s Desk is updated each business day.) Leisure activities in 2004On an average day in 2004, nearly everyone (96 percent) age 15 and over reported some sort of leisure or sports activity. Including the small portion of the population that reported no leisure activities, men spent more time doing leisure activities (5.6 hours) than women (4.8 hours). Watching TV was the leisure activity that occupied the most time, accounting for about half of leisure time on average for both men and women. Socializing, such as visiting with friends or attending or hosting social events, was the next most common leisure activity, accounting for about three-quarters of an hour per day for both sexes. Men were more likely than women to participate in sports on any given day and spent more time in sports activities on the days they participated. On average, individuals spent 33 percent more time (1.6 additional hours) in leisure and sports activities on weekend days than weekdays. TV watching and socializing and communicating each were about one-half hour per day greater on the weekends than on weekdays. The American Time Use Survey is the source of these data on time use. You can find out more about time spent at leisure activities in 2004 in American Time Use Survey — 2004 (PDF) (TXT), news release USDL 05-1766.
Related TED article: Happy 10th Birthday, TED!The very first issue of The Editor's Desk (TED) was posted on September 28, 1998. TED was the first online-only publication of the Bureau of Labor Statistics. For 10 years, BLS has been committed to posting a new TED article each business day, for a total of over 2,400 articles so far. |
Tools |
Calculators |
Help |
Info |