
Graphics For Media Use
This page gives you access to the original graphics files used to produce the USGS Summary on the new San Francisco Bay Region Earthquake Probability Study. The graphics are available in either Adobe Acrobat .pdf or .tif formats.
Please credit the USGS as the source of these graphics.
-
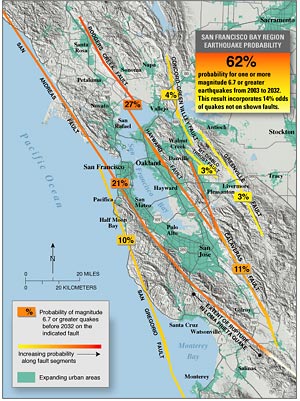
Probabilities (shown in boxes) of one or more major (M>=6.7) earthquakes on faults in the San Francisco Bay Region during the coming 30 years. The threat of earthquakes extends across the entire San Francisco Bay region, and a major quake is likely before 2032. Knowing this will help people make informed decisions as they continue to prepare for future quakes.
-
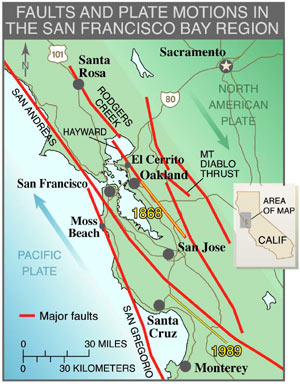
Faults and plate motions in the San Francisco Bay Region. Faults in the region, principally the seven faults shown here and characterized in this report, accommodate about 40 mm/yr of mostly strike-slip motion between the Pacific and North American tectonic plates. Yellow lines show the locations of the 1868 M6.8 earthquake on the southern portion of the Hayward Fault and the 1989 M6.9 Loma Prieta earthquake near the San Andreas fault northeast of Monterey Bay.
-
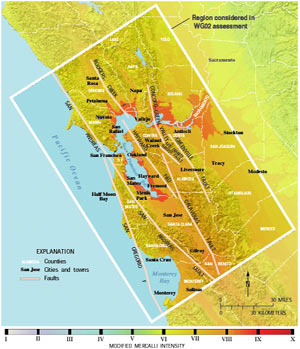
Shaking hazard of the SFBR, expressed as the modified Mercalli Intensity (MMI) having even odds of being exceeded in 30 years. Shaking hazard is high (MMI VII) throughout the region, and especially pronounced on the soft-soil areas surrounding the bays and the Sacramento River Delta.
-
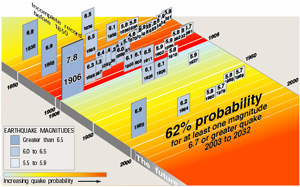
Earthquakes M 5.5 in the SFBR since 1850. The decrease in rate of large earthquakes in the 20th century has been attributed to a region-wide drop in stress due to the 1906 M7.8 earthquake, the "stress shadow" hypothesis.
-
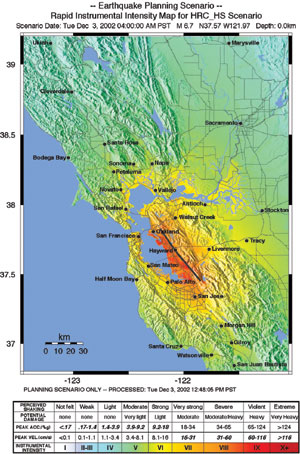
Scenario ShakeMap illustrating the strength and regional extent of shaking that can be expected from a future M 6.7 earthquake on the southern Hayward fault.
