
Seattle Seismic Hazard Maps and Data Download
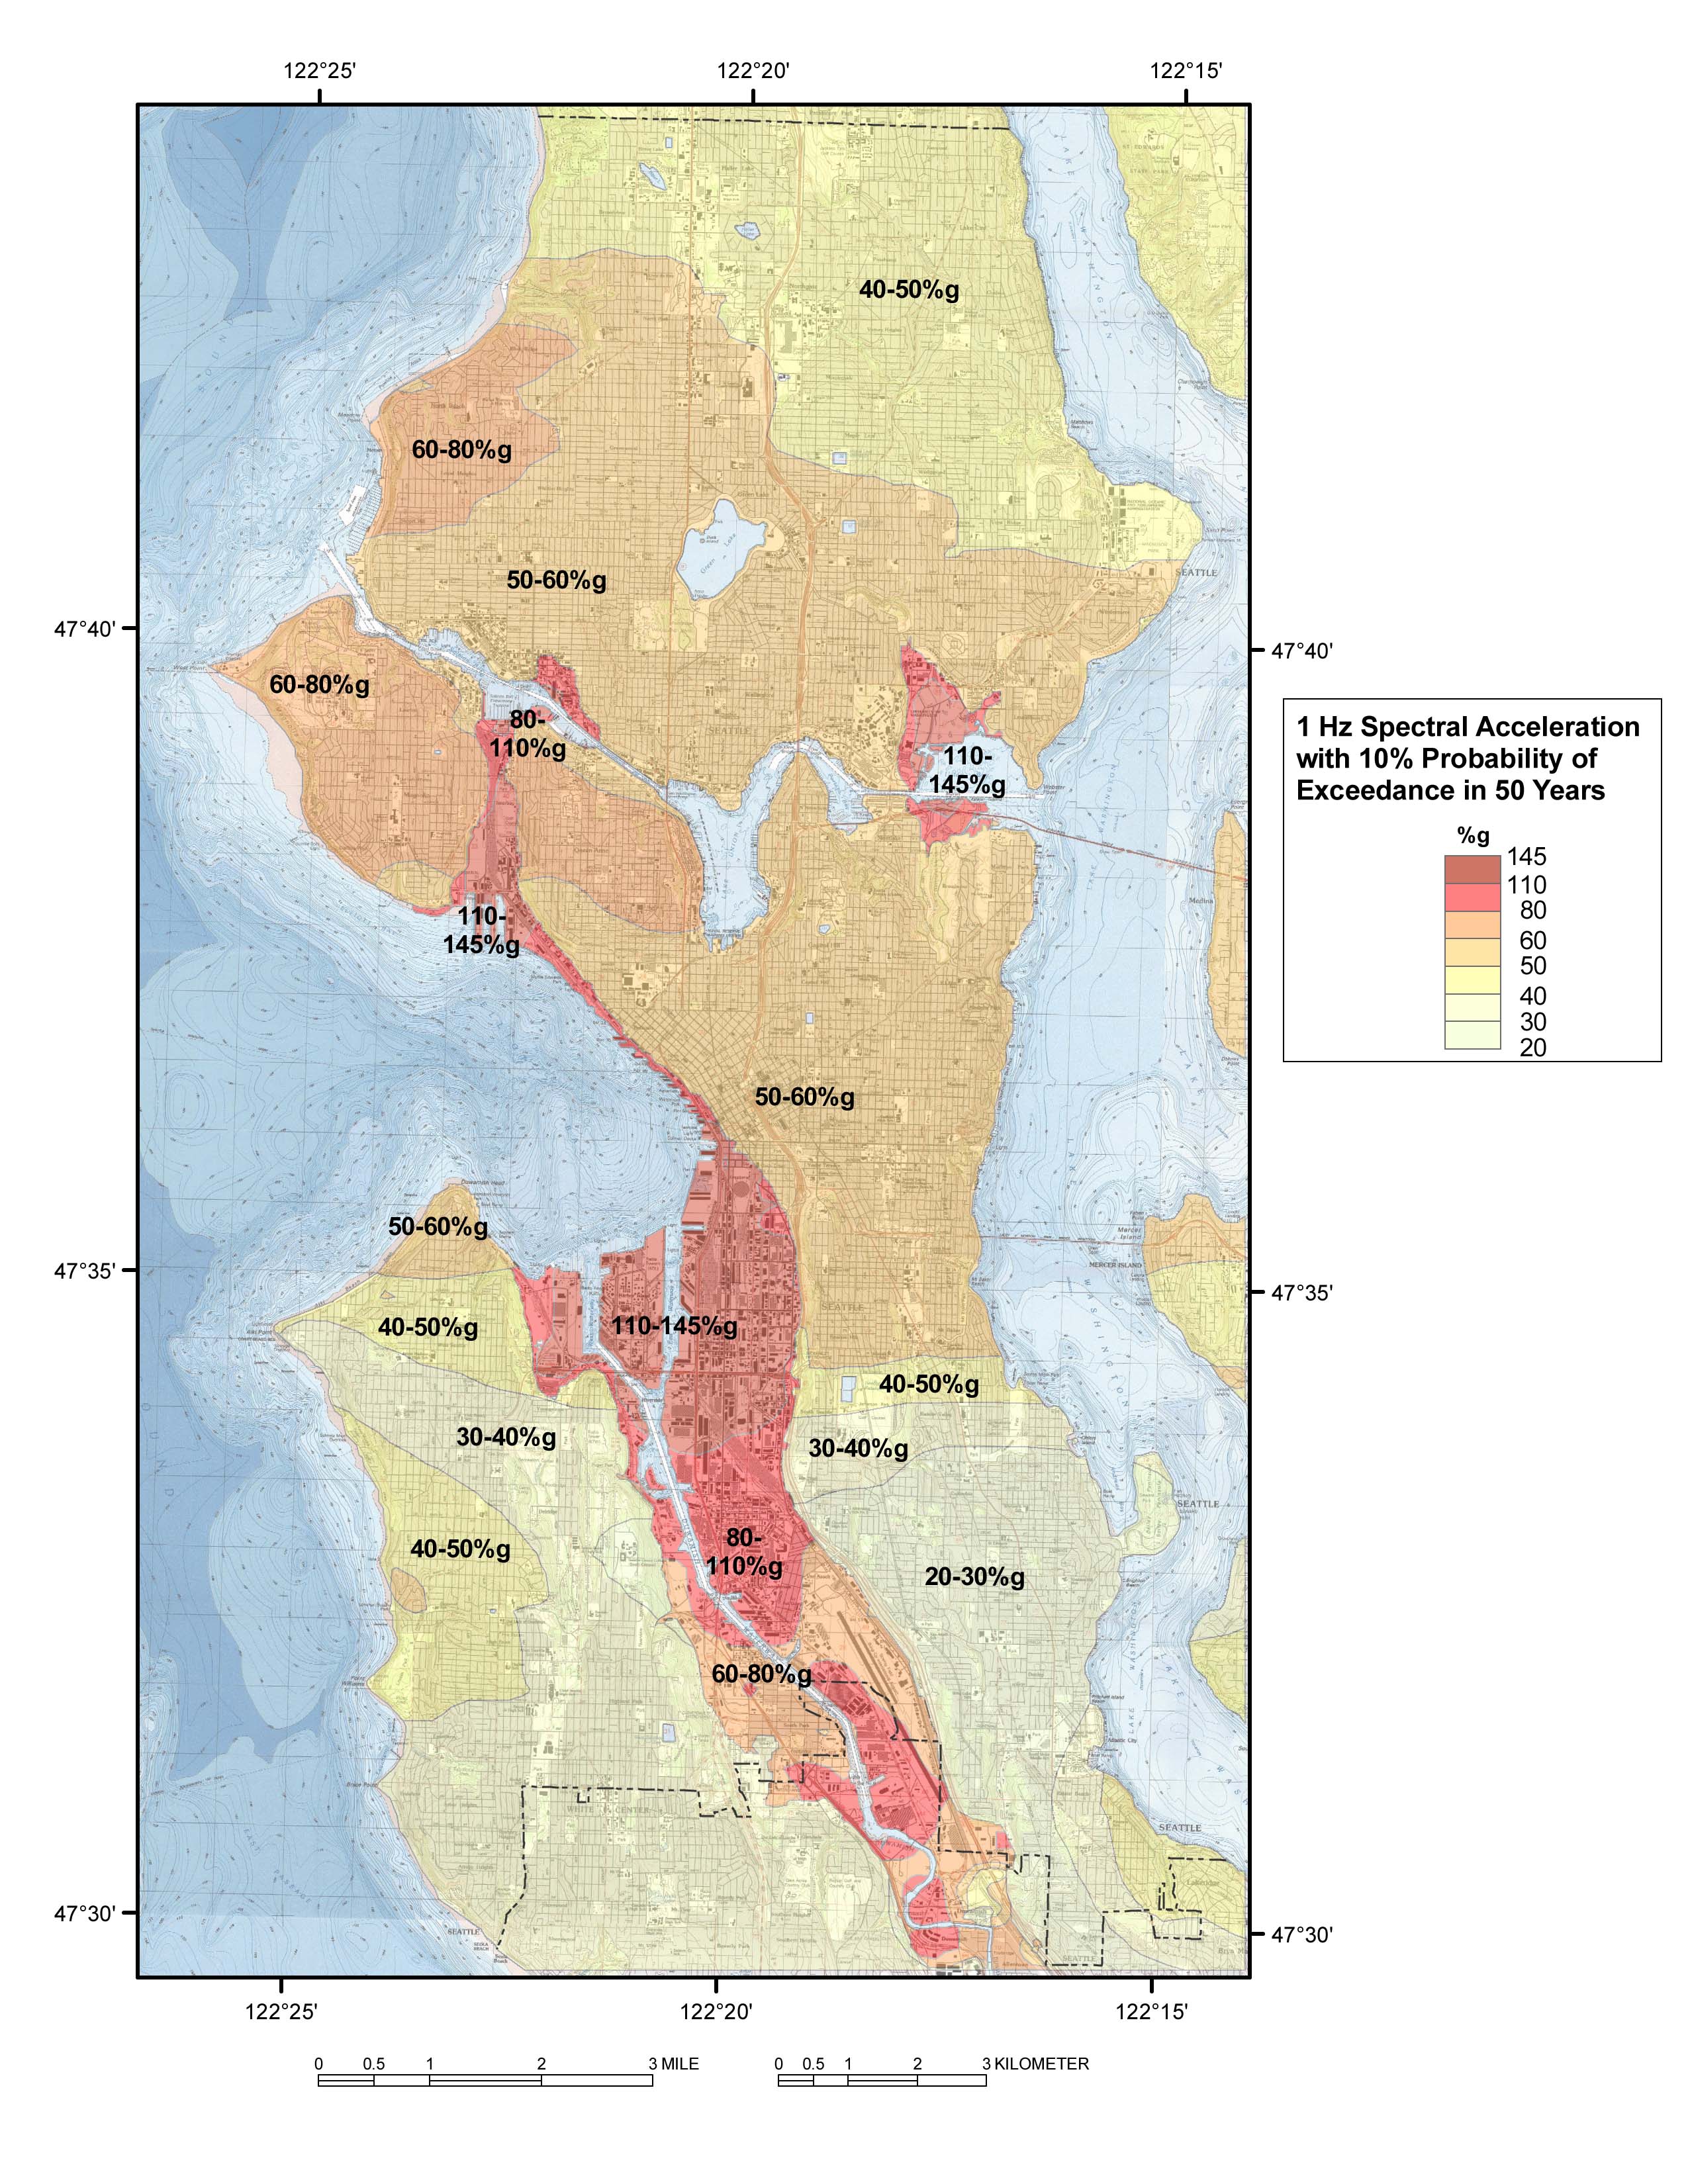
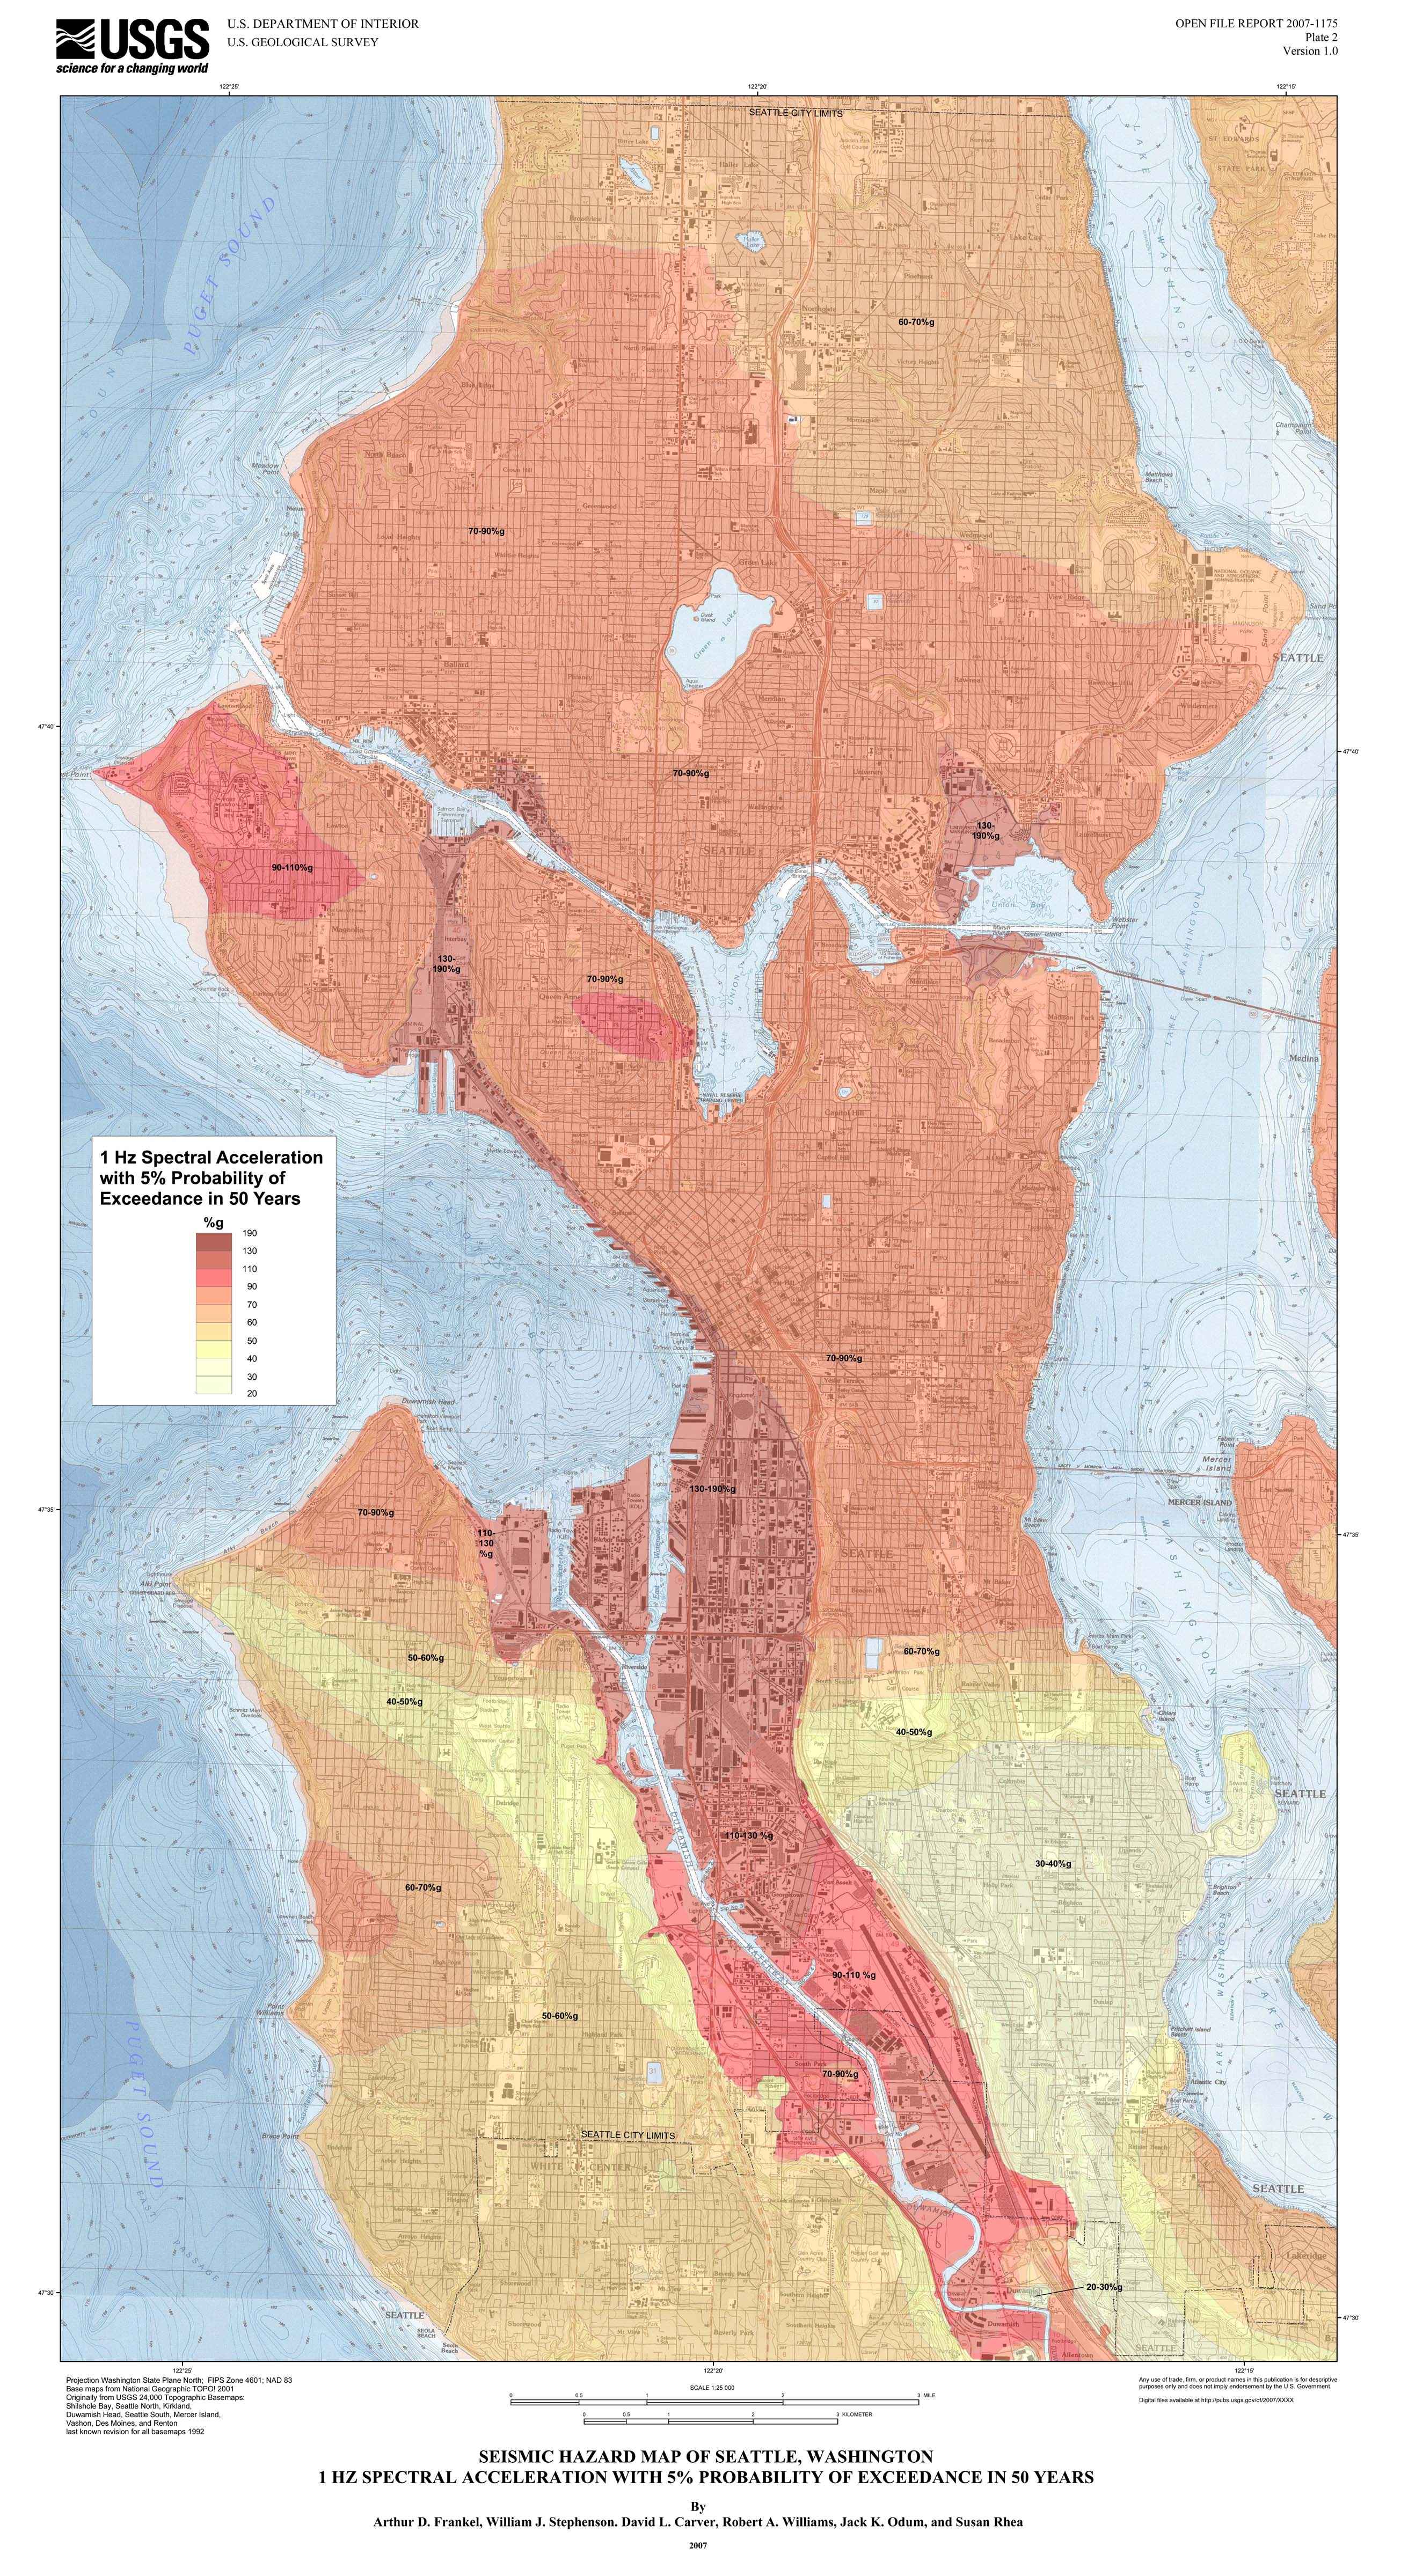
The USGS has produced a new series of earthquake hazard maps for the City of Seattle. These ‘urban seismic hazard’ maps provide a much higher-resolution view of the potential for strong earthquake shaking than previously available. This new view is particularly important for Seattle, which sits atop a sedimentary basin that strongly affects the patterns of earthquake ground shaking and therefore, of potential damage.
These hazard maps for Seattle depict the hazard for ground shaking at frequencies of about 1 cycle per second. Generally speaking, buildings of 10 stories in height are most sensitive to ground shaking at this frequency, so these maps show the hazard to medium-sized buildings. Since single-family houses are most sensitive to ground-shaking frequencies higher than 1 cycle per second, these maps may not always be a good indicator of the hazard to single-family houses. However, areas of artificial fill and young alluvium (soft soils), as indicated by the locations with highest hazard in these maps, have elevated levels of hazard for a variety of building types, including single-family houses. We are currently conducting research to assess the vulnerability of single-family houses to basin surface waves with frequencies around 1 cycle per second. We expect that many earthquake sources will produce such surface waves in the Seattle basin.
This introduction is continued on the Information Sheet
(Scroll down for Maps and Data downloads)

Definitions:
PE = probability of exceedance
SA = spectral acceleration
acceleration unit = %g
Graphical Formats
To view and print the PDF files, download the Adobe Acrobat Reader.
1.0 sec Spectral Acceleration (%g) with 10% Probability of Exceedance in 50
Years:
26 x 48 inch poster
50 Mbyte pdf || 12 Mbyte full size jpg || 2 Mbyte reduced size jpg
simple pagesize jpg
1.0 sec Spectral Acceleration (%g) with 5% Probability of Exceedance in 50
Years:
26 x 48 inch poster 50 Mbyte pdf || 12 Mbyte full size jpg || 2 Mbyte reduced size jpg
simple pagesize jpg
1.0 sec Spectral Acceleration (%g) with 2% Probability of Exceedance in 50
Years:
26 x 48 inch poster 50 Mbyte pdf || 12 Mbyte full size jpg || 2 Mbyte reduced size jpg
simple pagesize jpg
From the 2002 National Maps (for comparison purposes only; the 2002 data plotted on the same basemap)
1.0 sec Spectral Acceleration (%g) with 10% Probability of Exceedance in 50 Years: poster
1.0 sec Spectral Acceleration (%g) with 2% Probability of Exceedance in 50 Years: poster
Gridded Data Values (July 2007)
ASCII files of gridded points used to make maps - lon, lat, value (%g)
.0037 degrees (280 m) grid spacing in latitude and longitude
File sizes = approximately 300 Kb each
1.0
sec SA with 10% PE in 50 yrs
1.0 sec SA with 5% PE in 50 yrs
1.0 sec SA with 2% PE in 50 yrs
ArcGIS Shapefiles
.zip format
File sizes range from 55 to 160 Kb
Point Grids
1.0 sec SA with 10% PE in 50 yrs
1.0
sec SA with 5% PE in 50 yrs
1.0 sec SA with 2% PE in 50 yrs
Polygon Areas
1.0 sec SA with 10% PE in 50 yrs
1.0 sec SA with 5% PE in 50 yrs
1.0 sec SA with 2% PE in 50 yrs
Metadata
1.0
sec SA with 10% PE in 50 yrs point area
1.0 sec SA with 5% PE in 50 yrs point area
1.0 sec SA with 2% PE in 50 yrs point area
