Global RainSIM - Version 1.0
Welcome to the software download area! Please
contact us
if you have problems or questions.
Download Available
Global RainSIM
Version 1.0
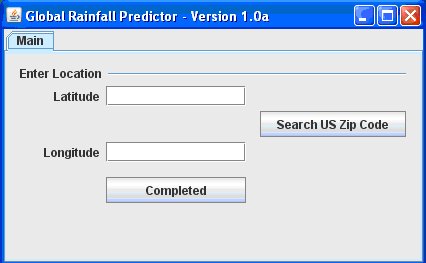
The purpose of this tool is to estimate daily precipitation patterns for a yearly cycle at any location on the globe. The user input is simply the latitude and longitude of the selected location. There is an embedded Zip Code search routine to find the latitude and longitude for US cities.
GlobalRainSIM forecasts the daily rainfall based upon two databases.The first was the average number of days in a month with precipitation (wet days) that were compiled and interpolated by Legates and Willmott (1990a and 1990b) with further improvements by Willmott and Matsuura (1995). The second database was the global average monthly precipitation data collected 1961-1990 and cross-validated by New et al. (1999). These two datasets were then used to establish the monthly precipitation totals and the frequency of precipitation in a month. The average precipitation event was calculated as the monthly mean divided by the number of wet days. This mean value was then randomly assigned to a day of the month looping through the number of wet days. In other words, if the average monthly rainfall was 10 mm/month with 5 average wet days, each rain event was 2 mm. This amount (2 mm) was then randomly assigned to 5 days of that month. The advantage of this tool is that a typical pattern of precipitation can be simulated for any global location arriving at an “average year” as a baseline case for comparison. This tool also outputs the daily rainfall as a file or can be easily embedded within another program.
References:
Legates, D. R. and C. J. Willmott (1990a) Mean Seasonal and Spatial Variability Global Surface Air Temperature. Theoretical and Applied Climatology , 41, 11-21.
Legates, D. R. and C. J. Willmott(1990b) Mean Seasonal and Spatial Variability in Gauge-Corrected, Global Precipitation. International Journal of Climatology, 10, 111-127.
New, M., Hulme, M. and Jones, P.D.(1999) Representing twentieth century space-time climate variability. Part 1: development of a 1961-90 mean monthly terrestrial climatology. Journal of Climate 12, 829-856.
Willmott, C. J. and K. Matsuura (1995) Smart Interpolation of Annually Averaged Air Temperature in the United States. Journal of Applied Meteorology, 34, 2577-2586.
Download Form
Please complete the form below to track the use of the service we are providing and to help improve our product.
|
|
|
|