ADE rates at two hospitals, 6 months, 2005
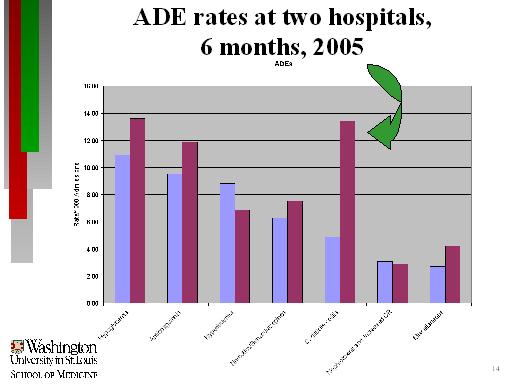
Bar graph showing the 6 month rate per 1000 admissions of two hospital's adverse drug events (ADEs) over a 6-month period for:
- Hypoglycemia
- Anticoagulants
- Hyperkalemia
- Narcotics/Benzodiazepines
- C. difficile colitis (A green arrow points out a particularly high number for the hospital represented by the red bar)
- Nephrotoxins and Increased CR
- Miscellaneous
 Previous Slide Contents Next Slide


 540 Gaither Road Rockville, MD 20850