You Are Here: AHRQ Home > About AHRQ > AHRQ 2007 Annual Conference > Slide Presentation
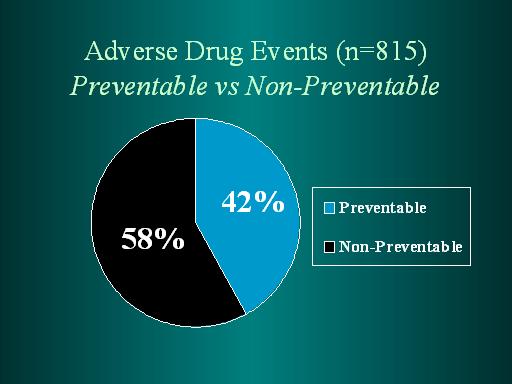
Pie chart showing percent of preventable vs. non-preventable adverse drug events in a sample of 815.
58% non-preventable
42% Preventable
Previous Slide Contents Next Slide
AHRQ Home | Questions? | Contact AHRQ | Site Map | Accessibility | Privacy Policy | Freedom of Information Act | Disclaimers U.S. Department of Health & Human Services | The White House | USA.gov: The U.S. Government's Official Web Portal
Agency for Healthcare Research and Quality 540 Gaither Road Rockville, MD 20850 Telephone: (301) 427-1364
 Previous Slide Contents Next Slide


 540 Gaither Road Rockville, MD 20850