Perceived advantages
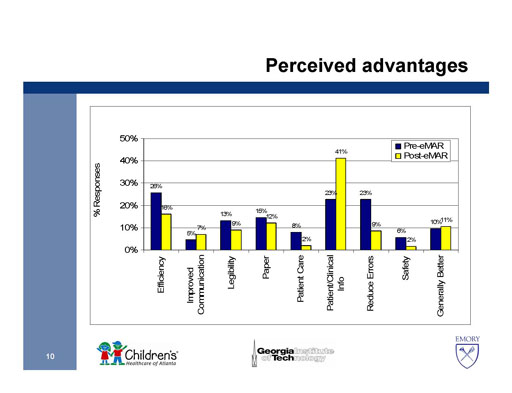
Bar graph of responses:
| Measure |
Efficiency |
Improved Communication |
Legibility |
Paper |
Patient Care |
Patient/
Clinical Info |
Reduce Errors |
Safety |
Generally Better |
| Stage |
pre-eMAR |
post-eMAR |
pre-eMAR |
post-eMAR |
pre-eMAR |
post-eMAR |
pre-eMAR |
post-eMAR |
pre-eMAR |
post-eMAR |
pre-eMAR |
post-eMAR |
pre-eMAR |
post-eMAR |
pre-eMAR |
post-eMAR |
pre-eMAR |
post-eMAR |
| % Responses |
20% |
16% |
5% |
7% |
13% |
9% |
15% |
12% |
8% |
2% |
23% |
41% |
23% |
9% |
6% |
2% |
10% |
11% |
 Previous Slide Contents Next Slide


 540 Gaither Road Rockville, MD 20850