
 Feeds & Data
PAGER - Background
PAGER–Rapid Assessment of an Earthquake's Impact (USGS Factsheet 2007-3101)
PAGER (Prompt Assessment of Global Earthquakes for Response) is an automated system to rapidly assess the number of people, cities, and regions exposed to severe shaking by an earthquake, and to inform emergency responders, government agencies, and the media to the scope of the potential disaster. PAGER monitors the U. S. Geological Survey's near-real-time detections of domestic and global earthquakes and automatically identifies events that are of societal importance, well in advance of ground-truth or news accounts.
The U.S. Geological Survey's National Earthquake Information Center (NEIC), located in Golden, Colorado, reports over 30,000 earthquakes a year. Tragically about 25 of these cause significant damage, injuries, or fatalities. The U.S. Geological Survey (USGS) often detects earthquakes well before eyewitness reports are available. It must then decide rapidly whether Federal and international agencies should be alerted to a potentially damaging event. In the past, the USGS primarily relied on the experience and intuition of its on-duty seismologists to estimate the impact of an event. To improve the accuracy of the assessment, the USGS has developed PAGER, an automated system to rapidly estimate the number of people and settlements exposed to severe shaking during earthquakes occurring anywhere in the world.
PAGER provides important information to help emergency relief organizations, government agencies, and the media plan their responses to earthquake disasters. Content includes, the instrumentally determined earthquake parameters of location, magnitude, and depth and an estimate of the number of people exposed to different severities of shaking, a useful indicator of potential impact. A regionally specific description of infrastructure vulnerability, and the potential for secondary hazards of landslides, tsunami, and fires, is automatically generated for most events. A table summarizes the predicted shaking intensity at nearby population centers and maps provide quick visual overviews of shaking levels and population densities.
This information is available on the USGS earthquake website and as a printable, one-page report (for example, this report on a damaging earthquake in Peru) with accompanying description. Fundamental to such a system, the USGS operates a robust computational and communication infrastructure necessary for earthquake response.
PAGER results are generally available within 30 minutes of a significant earthquake, shortly after the determination of its location and magnitude. However, information on the extent of shaking will be uncertain in the minutes and hours following an earthquake and typically improves as additional sensor data and reported intensities are acquired and incorporated into models of the earthquake's source. Users of PAGER exposure estimates should account for uncertainty and always seek the most current PAGER release for any earthquake.
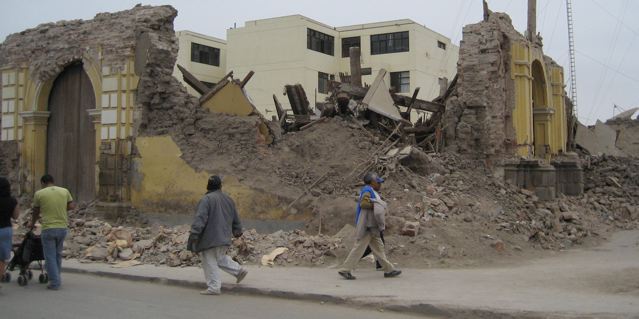
Photograph showing a collapsed adobe church in Pisco, Peru following the August 15th 2007 magnitude
8.0 earthquake. For events such as this, PAGER provides emergency relief organizations with information
that helps them to determine which areas likely require the most attention. Photograph by Emily
So, EEFIT UK
The PAGER Process
At the heart of PAGER are the timely and accurate earthquake location and magnitude determinations that the USGS has been producing for decades. PAGER uses these earthquake parameters to calculate estimates of ground shaking by using the methodology and software developed for ShakeMap. The number of people exposed to various levels of shaking is then calculated by combining the maps of predicted ground shaking with Oak Ridge National Laboratory’s Landscan population database. Finally, PAGER generates an regionally specific description of the vulnerability of the exposed population and infrastructure, potential for earthquake-induced landslides, and, if available, damage and fatality reports from previous nearby historic earthquakes for comparison purposes and damage projection.
Using the estimates of population exposure and the vulnerability of the local infrastructure, PAGER determines the scope of the catastrophe and issues alarms to emergency responders, government agencies, and the media. PAGER is an interactive system. As subsequent information becomes available, more accurate maps of ground shaking are produced, refined estimates of population exposures are made, and updated alarms are issued, if necessary.
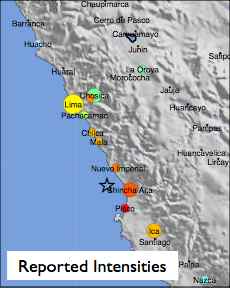
- After the magnitude and hypocenter of an earthquake are determined, PAGER retrieves any intensities reported by people in the epicenteral region via the online USGS "Did You Feel It?" system. The colored circles show the reported intensity at a city and the circle's size is proportional to population.
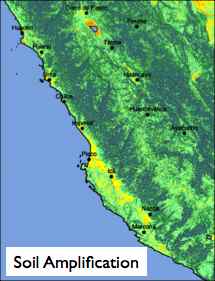
- PAGER generates a soil/rock site-specific ground-motion amplification map based on topographic slope. This map accounts for the tendency of soft-soil sites to experience stronger ground motion amplification than rock sites.
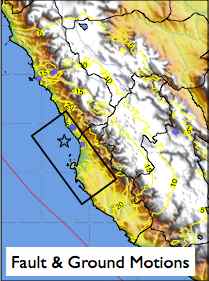
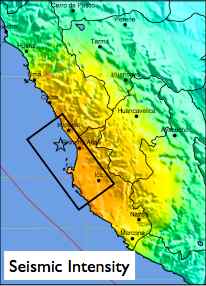
- Information about the fault geometry and size (black rectangle) is added when it becomes available. The ShakeMap system then produces regional ground shaking estimates (yellow contours) using the reported intensities, the site-specific ground-motion amplification map, and seismic wave attenuation equations that account for the variation of seismic shaking intensity with magnitude, distance and depth.
- The ShakeMap system then converts the estimated ground motions to a map of seismic intensity.
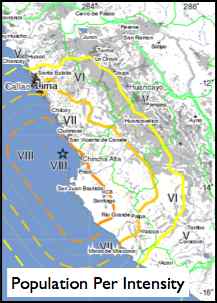
- The population affected at each intensity level is computed and intensities and populations at nearby cities tabulated by combining the map of intensity with the Landscan population database.
Ongoing PAGER Developments
At preset, PAGER notifications and Web pages estimate the population exposed to each seismic intensity level, a useful indicator of potential impact. USGS is improving the system to include a more comprehensive alert that will include casualty estimates, motivated by the idea that an estimated range of possible number of deaths will aid in decisions about humanitarian response.
The ability to model casualties and economic loss is being developed through several models that use approaches ranging from largely empirical to largely analytical. Selection of the most appropriate model for a particular earthquake will depend on how much is known about local building stocks and their vulnerability.
To calibrate the loss models, the USGS has generated an atlas of 3,900 ShakeMaps of significant global earthquakes that have occurred over the last 36 years. The calibration of loss methodologies relies on this atlas and on fatality and damage data collected by the NEIC. Related USGS developments under the auspices of the PAGER Project include rapid determination of fault geometry, size and rupture characteristics, ShakeMap enhancements, ground motion and loss uncertainty analyses, and intuitive ways to portray casualty and loss information and their uncertainties.
For more information, contact:
Paul Earle or David Wald
Earthquake Hazards Program
U.S. Geological Survey
Golden, CO 80401
