|
The diagram below illustrates the theoretical foundation of performance planning and evaluation structures, processes and results covered in this section of the Performance and Accountability Report. The outer circle represents the scope of the organization's resources and influence. At the core is its mission. Everything in between is in continuous motion, clockwise and counter-clockwise. Quadrants represent the planning elements that are tied to periodic budget documents. Spokes incorporate the actual processes that follow resource allocation decisions and translate theory into practice. These elements are managed on a real-time basis; emergent cost and results information ultimately closes the feedback loop via reporting documents and the next period's budget. A more detailed description of planning and evaluation processes follows the diagram.
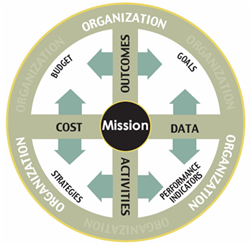 Planning Cycle
Starting with the upper left quadrant and moving clockwise, budget formulation begins with definition and prioritization of desired outcomes, which are translated from mere notions into realistic program goals. Goals drive data collection needs (to determine success) through performance indicators. Performance indicators identify results of activities, inducing strategies. Cost estimates associated with pursuit of these strategies inform budget requests.
Evaluation Cycle
Starting with the same quadrant but this time moving counter-clockwise, the budget defines fiscal parameters for execution of strategies constrained by program authorization legislation. Strategies materialize as activities, the results of which are assessed using performance indicators. Data from the performance indicators demonstrate whether goals are achieved. Outcomes — in generic terms, demonstrated effectiveness at achieving goals — justify further budget requests.
Program Performance Overview
Fiscal Year (FY) 2006 marks the eighth year that the Department of Labor has reported program results under the Government Performance and Results Act (GPRA). Program goals that are key to the accomplishment of Departmental strategic and outcome goals as presented in the FY 2003-2008 Strategic Plan1 were selected for inclusion in the Department's FY 2007 Performance Budget Overview.2 These performance goals and their indicators provide the basis for assessments of the Department's effectiveness in this section.
This report includes performance goals from two different reporting periods in that Workforce Investment Act (WIA) programs are "forward-funded," meaning that their spending and performance goals are tracked on a cycle that lags the Federal fiscal year by nine months. This period is referred to as a Program Year (PY); such goals being reported on in this document cover July 1, 2005 to June 30, 2006 (PY 2005). PY 2006 goals will appear in the FY 2007 report.
The Department's goal structure has three levels. Strategic goals describe general aims that emerge from the Department's mission. Each of these goals in turn has several outcome goals that define general results DOL agencies can influence. These are long term objectives that in most cases involve more than one DOL agency. Finally, performance goals that support each outcome goal provide program-level clarity of purpose. Each performance goal has associated indicators and targets to measure our impact on a continuous basis.
DOL's four strategic goals — A Prepared Workforce, A Secure Workforce, Quality Workplaces and A Competitive Workforce — express outcomes associated with our mission, vision and theme, and serve to focus Departmental efforts on the links between activities and their higher purpose. The table below indicates FY 2006 program performance goal achievement by strategic goal. The Department of Labor measures goal achievement by a rule requiring that all indicator targets are reached to qualify as Achieved. Substantially Achieved, which recognizes results that were very close, requires that 80 percent of targets are reached or substantially reached.3
Of the 28 performance goals on which DOL is reporting in FY 2006, the Department achieved 14 and did not achieve 14. The percentage achieved or substantially achieved totals 50 percent — somewhat lower than the 60 percent total for FY 2005. A swing of three goals would account for this. Strategic Goal 2 accounts for two of them. Five of its six performance goals were achieved or substantially achieved last year but just three were this time. The other change occurred in Strategic Goal 3, where the goal count increased from six to eight but the count of goals achieved remained at three.
1http://www.dol.gov/_sec/stratplan/main.htm
2http://www.dol.gov/_sec/Budget2007/overview-pb.htm#app1
3Substantially reached is defined as 80 percent of targeted year-on-year improvement.
DOL Strategic Goal |
Achieved |
Substantially
Achieved |
Not
Achieved |
Total |
Goal 1 — A Prepared Workforce
Enhance Opportunities for America's Workforce |
4 |
0 |
2 |
6 |
Goal 2 — A Secure Workforce
Promote the Economic Security of Workers and Families |
3 |
0 |
3 |
6 |
Goal 3 — Quality Workplaces
Foster Quality Workplaces that are Safe, Healthy and Fair |
3 |
0 |
5 |
8 |
Goal 4 — A Competitive Workforce
Maintain Competitiveness in the 21st Century Economy |
4 |
0 |
4 |
8 |
Total |
14 |
0 |
14 |
28 |
Below is a breakdown, by strategic goal, of FY 2006 goal achievement. Tables present the goal number, responsible agency, goal statement, and result for each performance goal being reported on in this document. The first two digits of each goal number indicate the funding year. In this report, all "05" goals are reporting on the Program Year period defined above.
A tally of goals achieved, while providing an indication of whether DOL is on schedule with its plan, does not convey any actual performance information. To understand what was achieved in terms of benefits to the public, it is necessary to look not just at whether goals were achieved and targets were reached but also at whether observed results indicate positive program impacts. Summaries at the strategic goal level and separate performance goal narratives discuss significant trends and their implications.
Strategic Goal 1 — A Prepared Workforce
As indicated in the Program Performance Goal Achievement table below, DOL had six performance goals under this strategic goal in FY 2006, of which four were achieved or substantially achieved (67 percent) — above the Department wide average. The WIA Youth program achieved its goal of collecting baseline data for its two new common youth and lifelong learning performance measures for Federal employment and training programs. The Job Corps program, which uses the same two measures for placement and credentials, plus a third common measure for literacy/numeracy, did not achieve its goal. VETS' goal was achieved; all six targets were reached. The goal for Apprenticeship was achieved; retention and earnings results improved over FY 2005. ODEP achieved its goal by establishing baselines for policy-related documents and formal agreements and reaching its target for identifying effective practices. BLS' goal was not achieved, but four of its six targets were reached.
Goal # |
Performance Goal (Agency) |
Result |
05-1.1A |
Increase placements and educational attainments of youth served through the WIA youth program. (ETA) |
Achieved |
05-1.1B |
Improve educational achievements of Job Corps students, and increase participation of Job Corps graduates in employment and education. (ETA) |
Not Achieved |
05-1.1C |
Improve the employment outcomes for veterans who receive One-Stop Career Center services and veterans' program services. (VETS) |
Achieved |
06-1.1A |
Improve the registered apprenticeship system to meet the training needs of business and workers in the 21st Century. (ETA) |
Achieved |
06-1.1B |
Advance knowledge and inform disability employment policy that affects systems change throughout the workforce development system. (ODEP) |
Achieved |
06-1.2A |
Improve information available to decision-makers on labor market conditions, and price and productivity changes. (BLS) |
Not Achieved |
Strategic Goal 2 — A Secure Workforce
Of six performance goals, DOL achieved or substantially achieved three — matching the Departmental average of 50 percent. ESA's Wage and Hour Division achieved its goal by reaching all five targets, but the Office of Labor-Management Standards missed one of its three targets, preventing it from achieving the goal. The Unemployment Insurance system also missed one target and therefore did not achieve the goal. The goal of improving outcomes for injured workers covered by ESA's Office of Workers' Compensation Programs was achieved; all ten indicator targets for Return to Work, Reducing Program Expenses, and Customer Service categories were reached. DOL achieved its pension and health benefit security goal by reaching all four targets. The pension insurance services (PBGC) goal was not achieved because neither of its customer satisfaction targets was reached.
Goal # |
Performance Goal (Agency) |
Result |
06-2.1A |
American workplaces legally employ and compensate workers. (ESA) |
Achieved |
06-2.1B |
Ensure union financial integrity, democracy and transparency. (ESA) |
Not Achieved |
06-2.2A |
Make timely and accurate benefit payments to unemployed workers, facilitate the reemployment of Unemployment Insurance (UI) claimants, and set up unemployment tax accounts promptly for new employers. (ETA) |
Not Achieved |
06-2.2B |
Minimize the impact of work-related injuries. (ESA) |
Achieved |
06-2.2C |
Secure pension, health and welfare benefits. (EBSA) |
Achieved |
06-2.2D |
Improve pension insurance program. (PBGC) |
Not Achieved |
Strategic Goal 3 — Quality Workplaces
DOL achieved or substantially achieved three of eight performance goals (38 percent), which is below the Departmental average of 50 percent. MSHA did not achieve its fatality and injury reduction goal. The fatality rate rose and the injury rate declined, but not enough to reach the target. MSHA also failed to meet its health goal, despite reaching three of four targets. The all-industry occupational fatality rate decreased in FY 2006 but did not reach OSHA's target. The safety and health goal (days away from work) was achieved. Both Federal contractor equal employment opportunity targets were reached, thus ESA's Office of Federal Contract Compliance Programs performance goal was achieved. The Uniformed Services Employment and Reemployment Rights Act goal was not achieved, despite improvement in the comprehensive Progress Index. The Bureau of International Labor Affairs, or ILAB, achieved its child labor goal by exceeding its target for removing or preventing children from exploitive work and increasing targeted countries' capacity to address the issue. The goal to improve living standards and working conditions internationally was not achieved.
Goal # |
Performance Goal (Agency) |
Result |
06-3.1A |
Reduce work-related fatalities and injuries. (MSHA) |
Not Achieved |
06-3.1B |
Reduce mining-related illnesses. (MSHA) |
Not Achieved |
06-3.1C |
Reduce work-related fatalities. (OSHA) |
Not Achieved |
06-3.1D |
Reduce work-related injuries and illnesses. (OSHA) |
Achieved |
06-3.2A |
Federal contractors achieve equal opportunity workplaces. (ESA) |
Achieved |
06-3.2B |
Reduce employer-employee employment issues originating from service members' military obligations conflicting with their civilian employment. (VETS) |
Not Achieved |
06-3.3A |
Contribute to the elimination of the worst forms of child labor internationally. (ILAB) |
Achieved |
06-3.3B |
Improve living standards and conditions of work internationally. (ILAB) |
Not Achieved |
Strategic Goal 4 — A Competitive Workforce
Of eight performance goals, DOL achieved or substantially achieved four, equaling the Departmental average of 50 percent. The WIA Adult and One Stop employment services goals were achieved. In each case, all three targets were reached. However, entered employment and retention rates were slightly below PY 2004 results. The WIA Dislocated Worker (DW) and Trade Adjustment Assistance (TAA) goals were not achieved. For DW, entered employment reached the target, but retention dipped below the target and was three percentage points below the prior year's performance. The TAA program achieved targeted levels for retention and earnings but fell just shy of the target for entered employment. The Senior Community Service Employment Program (SCSEP) did not achieve its performance goal. None of its targets were reached — entered employment and retention due to unrealistic targets, and average earnings because baseline data were not collected. The Department achieved its performance goal for electronic tools, exceeding the target for increased dissemination of O*NET data and setting baselines for Career Voyages and America's Career InfoNet Web site page views. The Foreign Labor Certification goal was not achieved, but three of four targets were reached.
The Department's regulatory flexibility and benefits and flexible workplace goal was achieved. In the course of promulgating revised regulations, DOL agencies conducted cost benefit analyses to increase regulations' net benefits. They also updated obsolete, non-substantive references in the Code of Federal Regulations. The Women's Bureau's Flex-Options for Women project participation grew to six of ten Regional Offices and had its most successful year to date, with 23 companies implementing new, exemplary workplace policies and procedures.
Goal # |
Performance Goal (Agency) |
Result |
05-4.1A |
Increase the employment, retention, and earnings of individuals registered under the Workforce Investment Act adult program. (ETA) |
Achieved |
05-4.1B |
Improve the outcomes for job seekers and employers who receive One-Stop employment and workforce information services. (ETA) |
Achieved |
05-4.1C |
Increase the employment, retention, and earnings replacement of individuals registered under the Workforce Investment Act Dislocated Worker Program. (ETA) |
Not Achieved |
05-4.1D |
Assist older workers to participate in a demand-driven economy through the Senior Community Employment Service Program. (ETA) |
Not Achieved |
05-4.1E |
Increase accessibility of workforce information through the National Electronic Tools. (ETA) |
Achieved |
06-4.1A |
Address worker shortages through the Foreign Labor Certification Program. (ETA) |
Not Achieved |
06-4.1B |
Increase the employment, retention, and earnings replacement of workers dislocated in important part because of trade who receive trade adjustment assistance benefits. (ETA) |
Not Achieved |
06-4.2A |
Maximize regulatory flexibility and benefits and promote flexible workplace programs. (OASP) |
Achieved |
The next table lists Program Year 2006 goals (July 1, 2006 — June 30, 2007) for which results will be reported in the FY 2007 Performance and Accountability Report. Due to restructuring of the Department's goals in the FY 2006-2011 Strategic Plan, identifying numbers have changed. The goals are listed according to their original nomenclature; the new labels are provided also, in bold type.
Old Goal#
|
New Goal# |
Performance Goal (Agency) |
06-1.1A |
06-1B |
Improve educational achievements of Job Corps students, and increase participation of Job Corps graduates in employment and education. (ETA) |
06-1.1B |
06-1C |
Increase placements and educational attainments of youth served through the WIA youth program. (ETA) |
06-1.1E |
06-1E |
Increase the employment outcomes for veterans who receive One Stop Career Center services and veterans' program services. (VETS) |
06-4.1A |
06-2A |
Increase the employment, retention, and earnings of individuals registered under the Workforce Investment Act Adult program. (ETA) |
06-4.1B |
06-2C |
Improve the outcomes for job seekers and employers who receive One Stop employment and workforce information services. (ETA) |
06-4.1C |
06-2B |
Increase the employment, retention, and earnings replacement of individuals registered under the Workforce Investment Act Dislocated Worker program. (ETA) |
06-4.1D |
06-2F |
Assist older workers to participate in a demand-driven economy through the Senior Community Service Employment Program. (ETA) |
06-4.1E |
06-2D |
Build a demand-driven workforce system through Community Based Job Training Grants. (ETA) |
06-4.1F |
06-2E |
Increase accessibility of workforce information through the National Electronic Tools. (ETA) |
Total Net Cost4 of DOL activities for FY 2006 was $45.328 billion. As reflected in the table below, which provides an allocation based on the Department's goal structure, the second strategic goal, A Secure Workforce, is dominant — accounting for $35.920 billion, or 79 percent of the total. This figure consists in large part ($33.227 billion, or 93 percent) of mandatory benefit payments to unemployed workers or workers disabled as a result of work-related injuries or illnesses. The first goal, A Prepared Workforce, required $3.395 billion (7 percent) for employment-related services. Approximately $1.114 billion (2 percent) went toward the third goal, Quality Workplaces, to fund direct services (such as salaries of Federal employees) aimed at improving safety and health in the workplace. The fourth goal, A Competitive Workforce, accounted for $4.889 billion, 11 percent of the total, which went toward job training programs and other services aimed at building a demand-driven workforce system.
DOL's FY 2005 Performance and Accountability Report marked a milestone in accountability by featuring a statement of full costs at the performance goal level. This year's statement adds another level of detail — performance indicators — which is significant because only by linking cost to units of measurement is it possible to analyze efficiency and cost-effectiveness. For a variety of reasons, this was not possible in all cases; therefore, the statement includes a row for each performance goal labeled "Dollars not associated with indicators." Some of the difficulties will be resolved over time and lead to more complete allocations in future statements. Others, such as for job training program common measures,5 cannot be resolved without dropping indicators — a choice that may reduce the overall value of performance information. As indicated in the preceding paragraph, several programs make mandatory benefit payments that account for the majority of their costs. Because performance indicators and the Department's managerial cost accounting system that generates this information are designed to inform analysis and decision-making related to discretionary budgets and program management, such payments are shown separately and not included in allocation cost models.
4Net cost data are presented. Net Cost reflects the full cost of each program as assigned by DOL entities to the Department's outcome goals less any exchange revenue earned. Full cost consists of (a) both direct and indirect costs, and (b) the costs of identifiable supporting services provided by other segments within the reporting entity and by other reporting entities.
5Entered employment, employment retention and earnings change are measures of different outcomes for each individual participant, and program activities are not separable into categories associated with one or another of these measures. The statement indicates intentional combination of costs for these measures by merging cells.
DOL Program Net Costs (Millions of Dollars) |
Goal |
FY 2004 |
FY 2005 |
FY 2006 |
Strategic Goal 1: A Prepared Workforce6 |
$8654 |
$3250 |
$3395 |
Outcome Goal 1.1 — Increase Opportunities for New and Re-emerging Entrants to the Workforce |
— |
$2714 |
$2822 |
Performance Goal 05-1.1A (WIA Youth) |
— |
947 |
1017 |
Percent of youth who are in employment or the military or enrolled in post secondary education and/or advanced training/occupational skills training in the first quarter after exit |
— |
— |
214 |
Percent of students who attain a GED, high school diploma, or certificate by the end of the third quarter after exit |
— |
— |
803 |
Dollars not associated with indicators |
— |
— |
— |
Performance Goal 05-1.1B (Job Corps) |
— |
1309 |
1402 |
Percent of Job Corps graduates (within 1 year of program exit) and former enrollees (within 90 days of program exit) who will enter employment or enroll in post-secondary education or advanced training/occupational skills training |
— |
— |
— |
Percent of students who will attain a GED, high school diploma or certificate while enrolled in the program |
— |
— |
— |
Percent of students who achieve literacy or numeracy gains of one Adult Basic Education (ABE) level |
— |
— |
— |
Dollars not associated with indicators |
— |
— |
1402 |
Performance Goal 05-1.1C (VETS employment services) |
— |
196 |
198 |
Percent of Veteran job seekers employed in the first or second quarter following registration |
— |
— |
78 |
Percent of Veteran job seekers still employed two quarters after initial entry into employment with a new employer |
— |
— |
Percent of Disabled Veteran job seekers employed in the first or second quarter following registration |
— |
— |
78 |
Percent of Disabled Veteran job seekers still employed two quarters after initial entry into employment with a new employer |
— |
— |
Entered employment rate for homeless veterans participating in the Homeless Veterans' Reintegration Program (HVRP) |
— |
— |
21 |
Employment retention rate after 6 months for homeless veteran HVRP participants |
— |
— |
Dollars not associated with indicators |
— |
— |
21 |
Performance Goal 06-1.1A (Apprenticeship) |
— |
23 |
25 |
Percent of those employed nine months after registration as an apprentice |
— |
— |
25 |
Average hourly wage gain for tracked entrants employed in the first quarter after registration and still employed nine months later |
— |
— |
Dollars not associated with indicators |
— |
— |
— |
Performance Goal 06-1.1B (ODEP) |
— |
52 |
50 |
Number of policy related documents disseminated |
— |
— |
— |
Number of formal agreements initiated |
— |
— |
— |
Number of effective practices identified |
— |
— |
— |
Dollars not associated with indicators |
— |
— |
50 |
Other (Youth Offender Reintegration, Indian and Native American Youth Programs, etc.) |
— |
187 |
131 |
Outcome Goal 1.2 — Improve the Effectiveness of Information and Analysis on the U.S. Economy |
$539 |
$536 |
$573 |
Performance Goal 06-1.2A (BLS) |
— |
536 |
573 |
Percent of output, timeliness, accuracy, and long-term improvement targets achieved for labor force statistics |
— |
— |
— |
Percent of output, timeliness, accuracy, and long-term improvement targets achieved for prices and living conditions |
— |
— |
— |
Percent of output, timeliness, accuracy, and long-term improvement targets achieved for compensation and working conditions |
— |
— |
— |
Percent of output, timeliness, accuracy, and long-term improvement targets achieved for productivity and technology |
— |
— |
— |
Cost per transaction of the Internet Data Collection Facility |
— |
— |
— |
Customer satisfaction with BLS products and services (e.g., the American Customer Satisfaction Index) |
— |
— |
— |
Dollars not associated with indicators |
— |
— |
573 |
Strategic Goal 2: A Secure Workforce |
$46,957 |
$40,811 |
$35,920 |
Outcome Goal 2.1 — Increase Compliance With Worker Protection Laws |
$296 |
$277 |
$270 |
Performance Goal 06-2.1A (Wage and Hour) |
— |
214 |
214 |
Number of workers for whom there is an agreement to pay or an agreement to remedy per 1,000 enforcement hours |
— |
— |
112 |
Percent of prior violators who achieved and maintained FLSA compliance following a full FLSA investigation |
— |
— |
27 |
Percent of low-wage workers across identified low-wage industries paid and employed in compliance with FLSA |
— |
— |
39 |
Number of wage determination data submission forms processed per 1000 hours |
— |
— |
23 |
Percent of survey-based DBA wage determinations issued within 60 days of receipt of the underlying survey data |
— |
— |
6 |
Dollars not associated with indicators |
— |
— |
6 |
Performance Goal 06-2.1B (Labor-Management Standards) |
— |
63 |
56 |
Percent of unions with fraud |
— |
— |
18 |
Percent of unions complying with standards for democratic union officer elections |
— |
— |
11 |
Percent of union reports meeting OLMS standards of acceptability for public disclosure |
— |
— |
8 |
Dollars not associated with indicators |
— |
— |
20 |
Outcome Goal 2.2 — Protect Worker Benefits7 |
$46,661 |
$40,534 |
$35,650 |
Performance Goal 06-2.2A (Unemployment Insurance) |
— |
34,243 |
33,340 |
Mandated benefit payments |
— |
— |
31,322 |
Percent of intrastate first payments made within 21 days |
— |
— |
— |
Percent of the amount of estimated detectable/recoverable overpayments that the States can establish for recovery |
— |
— |
— |
Percent of UI claimants who were reemployed by the end of the first quarter after the quarter in which they received their first payment |
— |
— |
— |
Percent of new employer liability determinations made within 90 days of the end of the first quarter in which liability occurred |
— |
— |
— |
Dollars not associated with indicators |
— |
— |
2018 |
Performance Goal 06-2.2B (Workers' compensation) |
— |
6131 |
2130 |
Mandated benefit payments |
— |
— |
1905 |
Lost production days rate (LPD per 100 employees) for FECA cases of the United States Postal Service |
— |
— |
3 |
Lost production days rate (LPD per 100 employees) for FECA cases of All Other Government Agencies |
— |
— |
3 |
Cost savings through staff-initiated evaluation of cases under Periodic Roll Management for changes in medical condition and fitness for duty |
— |
— |
9 |
Trend in the indexed cost per case of FECA cases receiving medical treatment (compared to nationwide health care costs) |
— |
— |
4 |
Targets for five communications performance areas |
— |
— |
3 |
Average days required to resolve disputed issues in Longshore and Harbor Worker's Compensation Program contested cases |
— |
— |
3 |
Percent of eligible Black Lung benefit claims for which there are no requests for further action pending one year after the date the claim is filed |
— |
— |
13 |
Percent of Initial Claims for benefits in the Part B and Part E Energy Programs processed within standard timeframes |
— |
— |
9 |
Percent of Final Decisions in the Part B Energy Program processed within standard timeframes |
— |
— |
11 |
Percent of EEOICPA Part E claims backlog receiving recommended decisions |
— |
— |
— |
Dollars not associated with indicators |
— |
— |
166 |
Performance Goal 06-2.2C (EBSA) |
— |
160 |
179 |
Ratio of closed civil cases with corrected violations to civil cases closed |
— |
— |
— |
Ratio of criminal cases referred for prosecution to total criminal cases |
— |
— |
— |
Customer Satisfaction Index for participants and beneficiaries who have contacted EBSA for assistance |
— |
— |
— |
Applications to Voluntary Compliance programs |
— |
— |
— |
Dollars not associated with indicators |
— |
— |
179 |
Strategic Goal 3: Quality Workplaces |
$1021 |
$1062 |
$1114 |
Outcome Goal 3.1 — Reduce Workplace Injuries, Illnesses, and Fatalities |
$812 |
$823 |
$868 |
Performance Goal 06-3.1A (MSHA safety) |
— |
— |
223 |
Mine industry fatal injury incidence rate (per 200,000 hours worked) |
— |
— |
— |
Mine industry all-injury incidence rate (per 200,000 hours worked) |
— |
— |
— |
Dollars not associated with indicators |
— |
— |
223 |
Performance Goal 06-3.1B (MSHA health) |
— |
— |
125 |
Percent of respirable coal dust samples exceeding the applicable standards for designated occupations |
— |
— |
— |
Percent of silica dust samples with at least 50% of the permissible exposure limits in metal and non-metal mines |
— |
— |
— |
Percent of noise samples with at least 50% of the permissible exposure limits in metal and non-metal mines |
— |
— |
— |
Percent of noise samples above the citation level in coal mines |
— |
— |
— |
Dollars not associated with indicators |
— |
— |
125 |
Performance Goals 06-3.1C&D (OSHA fatality, safety and health)8 |
— |
— |
519 |
Outcome Goal 3.2 — Foster Equal Opportunity Workplaces |
$112 |
$115 |
$114 |
Performance Goal 06-3.2A (Federal Contractor Compliance) |
— |
99 |
97 |
Incidence of discrimination among Federal contractors |
— |
— |
68 |
Compliance among Federal contractors in all other aspects of equal opportunity workplace standards |
— |
— |
29 |
Dollars not associated with indicators |
— |
— |
— |
Performance Goal 06-3.2B (USERRA) |
— |
16 |
17 |
USERRA Progress Index (measures compliance and assistance performance) |
— |
— |
17 |
Dollars not associated with indicators |
— |
— |
— |
Outcome Goal 3.3 — Reduce Exploitation of Child Labor, Protect the Basic Rights of Workers, and Strengthen Labor Markets |
$97 |
$124 |
$132 |
Performance Goal 06-3.3A (Child Labor) |
— |
74 |
95 |
Number of children prevented or withdrawn from child labor and provided education and/or training opportunities as a result of DOL-funded child labor elimination projects |
— |
— |
95 |
Number of countries with increased capacities to address child labor as a result of DOL-funded child labor elimination projects |
— |
— |
Dollars not associated with indicators |
— |
— |
— |
Performance Goal 06-3.3B (International Labor Standards) |
— |
43 |
30 |
Percent of USDOL project beneficiaries who consider a USDOL-funded project to have improved their conditions of work |
— |
— |
10 |
Number of workers benefiting from compliance with national labor laws through improved inspections |
— |
— |
10 |
Percent of targeted individuals whose economic situation has benefited from USDOL project assistance |
— |
— |
— |
Number of targeted workers reporting a reduction in HIV/AIDS risk behaviors |
— |
— |
— |
Number of workplaces adopting policies and procedures to reduce the level of employment related discrimination against persons living with HIV/AIDS |
— |
— |
9 |
Dollars not associated with indicators |
— |
— |
— |
Other (Other ILAB programs) |
— |
7 |
7 |
Strategic Goal 4: A Competitive Workforce6 |
$6 |
$4943 |
$4889 |
Outcome Goal 4.1 — Build a Demand-Driven Workforce System |
— |
$4943 |
$4889 |
Performance Goal 05-4.1A (WIA Adult) |
— |
906 |
912 |
Percent of participants employed in the first quarter after program exit |
— |
— |
912 |
Percent of those employed in the first quarter after exit still employed in the second and third quarters after program exit |
— |
— |
Average earnings gain for participants employed in the first quarter after program exit and still employed in the third quarter after program exit |
— |
— |
Dollars not associated with indicators |
— |
— |
— |
Performance Goal 05-4.1B (One-Stop) |
— |
746 |
791 |
Percent of participants employed in the first quarter after program exit |
— |
— |
791 |
Percent of those employed in the first quarter after exit still employed in the second and third quarters after program exit |
— |
— |
Average earnings gain for participants employed in the first quarter after program exit and still employed in the third quarter after program exit |
— |
— |
Dollars not associated with indicators |
— |
— |
— |
Performance Goal 05-4.1C (WIA Dislocated Worker) |
— |
1472 |
1543 |
Percent of participants employed in the first quarter after program exit |
— |
— |
1543 |
Percent of those employed in the first quarter after program exit still employed in the second and third quarters after program exit |
— |
— |
Average percent of pre-separation earnings for participants employed in the first quarter after program exit and still employed in the third quarter after exit |
— |
— |
Dollars not associated with indicators |
— |
— |
— |
Performance Goal 05-4.1D (Senior Community Service Employment Program)9 |
— |
426 |
432 |
Percent of participants employed in the first quarter after program exit |
— |
— |
432 |
Percent of participants employed in the first quarter after program exit still employed in the second and third quarters after program exit |
— |
— |
Average earnings gain for participants employed in the first quarter after exit and still employed in the third quarter after exit |
— |
— |
Dollars not associated with indicators |
— |
— |
— |
Performance Goal 05-4.1E (Etools) |
— |
111 |
120 |
Number of page views on America's Career InfoNet |
— |
— |
— |
Number of O*NET site visits |
— |
— |
— |
Number of page views on Career Voyages |
— |
— |
— |
Dollars not associated with indicators |
— |
— |
120 |
Performance Goal 06-4.1A (Foreign Labor Certification) |
— |
60 |
46 |
Percent of H-1B applications processed within seven days of the filing date for which no prevailing wage issues are identified |
— |
— |
— |
Percent of employer applications for labor certification under the streamlined system that are resolved within six months of filing |
— |
— |
— |
Percent of H-2B applications processed within 60 days of receipt |
— |
— |
— |
Percent of accepted H-2A applications processed within 30 days of the date of need where there are no pending State actions |
— |
— |
— |
Dollars not associated with indicators |
— |
— |
46 |
Performance Goal 06-4.1B (Trade Adjustment Assistance) |
— |
846 |
700 |
Percent of participants employed in the first quarter after program exit |
— |
— |
700 |
Percent of participants employed in first quarter after exit who are still employed in the second and third quarters after exit |
— |
— |
Average percent of pre-separation earnings for participants employed in the first quarter after exit and still employed in the third quarter after exit |
— |
— |
Dollars not associated with indicators |
— |
— |
— |
Other (Indian and Native American Adult Programs, National Farmworker Jobs Program, Work Incentive Grants, Transition Assistance Program, Pilots, Demonstrations, Research & Evaluations, and H-1B Technical Skills Training) |
— |
376 |
345 |
Outcome Goal 4.2 — Promote Workplace Flexibility and Minimize Regulatory Burden10 |
$6 |
— |
— |
Costs Not Assigned to Goals |
$38 |
$11 |
$10 |
Total11 (may not be equal to sum of individual goal totals due to rounding) |
$56,676 |
$50,076 |
$45,328 |
6Costs reported in DOL's FY 2004 and FY 2005 Performance and Accountability Reports for outcome goal and strategic goal subtotals for Strategic Goals 1 and 4 are not valid for comparison to FY 2006 due to restructuring. This also applies at the performance goal level for ETA grant programs due to a change in allocation methodology. FY 2005 totals in this table have been restated to reflect these changes and facilitate comparison. The restructuring moved several performance goals that appeared in the FY 2005 table under Outcome Goal 1.1 to Outcome Goal 4.1 (WIA Adult, One-Stop, WIA Dislocated Worker and Other). All performance goals in the FY 2005 table under Outcome Goal 1.2 (WIA Youth, Job Corps, and Other) were moved into Outcome Goal 1.1 in FY 2006. The grant allocation change affected WIA Youth, Job Corps, WIA Adult, One-Stop, WIA Dislocated Worker, SCSEP, Etools and Other programs in Outcome Goals 1.1 and 4.1.
7Costs for Performance Goal 06-2.2D (PBGC) are not included because the corporation's financial statements are separate from those of the Department and are not included in this document.
8Costs for OSHA's two performance goals are combined because the same activities contribute to reductions in fatality and injury/illness indicators, i.e., their costs are not separable. Two indicators — one for each goal — account for all costs. Since no cost allocation is possible at that level, either, they are omitted.
9This is a new goal that was listed with Other in the FY 2005 table.
10Costs associated with this goal in FY 2004 were allocated to program performance goals in FY 2005. See the explanation in the Outcome Goal 4.2 narrative under Net Cost of Programs.
11Total net costs in this table do not match total net costs in the Consolidated Statements of Net Cost as certain costs in this table are presented on a program year basis. All costs in the Consolidated Statements of Net Cost are on a fiscal year basis.
Charts that display net costs from FY 1999-FY 2006 to illustrate trends are provided in each outcome goal summary; brief explanations of significant changes since FY 2005 are provided, as well. FY 2005 was the first year for which DOL had the capability of reporting costs at the performance goal level — thanks to more sophisticated cost models in our managerial cost accounting system, Cost Analysis Manager (CAM), that describe relationships between resources, activities, outputs and performance goals.
Reporting Performance Results
The Performance Section of this report presents, by strategic goal, summaries of performance at each level. Each strategic goal section is introduced by an overview of the goal and a summary of results, net cost and future plans for its component outcome goals. Within each strategic goal section are individual performance goal narratives that present results, describe the program and its operating environment, analyze performance and briefly address relevant audits and evaluations, data quality and major management challenges. Appendix 1 contains performance goal histories and Appendix 2 summarizes significant audits and evaluations of DOL programs completed during FY 2006 that have implications for performance goals.
Performance measurement is inherently difficult, especially for a large, diverse organization like DOL that works to accomplish its mission indirectly — in partnership and by assisting others. The Department seeks continuous improvement in its selection of indicators and in policies and procedures for collecting and reporting program performance data so that managers and other decision makers can rely on them. However, each program must consider the costs and benefits of gathering and managing such information. Changes take time to implement and reporting requirements can impose considerable burdens on staff, partners, beneficiaries and regulated entities.
This report is published just six weeks after the end of the fiscal year. Because the Department receives a wide variety of performance data via diverse systems and agreements in cooperation with State agencies and grant recipients, it is not possible in all cases to report complete data for the reporting period. The Department requires each agency responsible for performance goals in this report to submit a Data Estimation Plan in February that identifies, for each indicator, whether complete data are expected by the deadline for clearance and final review of the report in early October. If the data will not be available by then, they must submit an acceptable plan to estimate results for the remainder of the year. Methodologies developed by agencies' program analysts are reviewed by the Department's Center for Program Planning and Results and Office of Inspector General. The most common methods are substitution or extrapolation of two or three quarters of data and — for data with significant seasonal variation — use of the missing period's results from the previous year. Estimates are clearly identified wherever they are used. With very few exceptions, final (actual) data are available by the end of the calendar year; these data will be reported in the FY 2007 Performance and Accountability Report.
New indicators often lack data needed to establish targets. For such indicators, the first year's target may be to establish a baseline, and thus the Department gives the program a positive rating for gathering the data as planned and establishing targets for the subsequent year.
The Office of Inspector General assesses the internal controls of DOL agencies — systems used to validate, verify and record data submitted by field staff and partners (e.g., grantees). These systems are identified as Data Sources in Appendix 1 at the bottom of each performance goal history. Lack of findings does not imply that data are factual.
Material inadequacies, if any, are disclosed in the Secretary's Message, which includes a statement on the adequacy of program performance data that is supported by signed attestations of each agency head responsible for a performance goal in this report. OMB Circular A-11defines a material inadequacy as a condition that significantly impedes the use of program performance data by agency managers and government decision makers. For Departmental management, this threshold is established at the performance goal level as data that are insufficient to permit determination of goal achievement. This is an unlikely occurrence for a goal with several indicators and historical data that allow reasonable estimation of results for most of them. Generally, if agency or program level managers do not trust their own data, they are not reported, because problems created by skewed targets and trends are much worse than a gap in the data.
The Department of Labor aspires to standards beyond adequacy, and to that end has created a new Data Assessment process that will help improve the quality of performance information that is being used more than ever for decision-making and accountability. The Data Quality and Major Management Challenges section of each performance goal narrative includes an overall rating of indicator data completeness and reliability (Excellent, Very Good, Good, Fair, or Unsatisfactory). Discussions summarize the rationale and, where applicable, improvement plans. Data assessments are based on seven criteria, of which two — accuracy and relevance — are threshold criteria that are weighted twice as much as the other five in the scoring system that determines ratings (see box below). If data do not satisfy the standards for both of these criteria, the rating is Data Quality Not Determined. This reflects the DOL policy that further assessments of quality are irrelevant if the information is not reasonably correct and worthwhile.
Data Quality Rating System
Both bulleted descriptions under a criterion must be satisfied to receive points. No partial credit is awarded. The rating scale reflects 20 points for Section One "threshold" criteria plus additional points earned in Section Two. Data that do not satisfy both criteria presented in Section One are given the rating Data Quality Not Determined — regardless of the points achieved in Section Two. This rating indicates the agency is unable to assess data quality because it does not meet a minimum threshold.
Section One: 20 points
Accurate
Data are correct. (10 points)
- Deviations can be anticipated or explained.
- Errors are within an acceptable margin.
Relevant
Data are worth collecting and reporting. (10 points)
- Data can be linked to program purpose to an extent they are representative of overall performance.
- The data represent a significant budget activity or policy objective.
Section Two: 25 points
Complete
Data should cover the performance period and all operating units or areas. (5 points)
- If collection lags prevent reporting full-year data, a reasonably accurate estimation method is in place for planning and reporting purposes.
- Data do not contain any significant gaps resulting from missing data.
Reliable
Data are dependable. (5 points)
- Trends are meaningful; i.e., data are comparable from year-to-year.
- Sources employ consistent methods of data collection and reporting and uniform definitions across reporting units and over time.
Timely
Data are available at regular intervals during the performance period. (5 points)
- The expectation is that data are reported quarterly.
- Data are current enough to be useful in decision-making and program management.
Valid
Data measure the program's effectiveness. (5 points)
- The data indicate whether the agency is producing the desired result.
- The data allow the agency and the public to draw conclusions about program performance.
Verifiable
Data quality is routinely monitored. (5 points)
- Quality controls are used to determine whether the data are measured and reported correctly.
- Quality controls are integrated into data collection systems.
|
|
|
|
|
|
|
|
|
|
|
|
Data Quality Not Determined
|
|
|
Data for five goals are rated Excellent; nine are Very Good, ten are Good, three are Fair, and one is Data Quality Not Determined. This was the baseline year for these assessments, which were conducted late in the fiscal year, so in many cases agencies have not yet formulated improvement plans. As FY 2007/PY 2006 indicators and targets are finalized and data collection for the new fiscal year gets under way, program managers will prioritize data quality issues and consider feasible policies and practices that would have significant and positive impact on the criteria. The FY 2007 report will include a follow-up assessment and a more robust discussion of how the Department intends to make progress in this area.
DOL Strategic Plan: FY 2006-2011
In September 2006, the Department published its Strategic Plan for Fiscal Years 2006 through 2011. The strategic plan serves as a roadmap for programs to define priorities, refine strategies, and measure performance. In the 2007 Performance and Accountability report, DOL will report its progress against four updated strategic goals: A Prepared Workforce provides training and services to new and incumbent workers and supplies high-quality information on the economy and labor market; A Competitive Workforce enhances the effectiveness and efficiency of the workforce development and regulatory systems that assist workers and employers in meeting the challenges of worldwide competition; Safe and Secure Workplaces ensures that workplaces are safe, healthful, and fair; provides workers with the wages due them; provides equal opportunity; and protects veterans' employment and re-employment rights; and Strengthened Economic Protections protects and strengthens economic security; ensures union transparency; and secures pension and health benefits.
 |
|
 |
| |
|