
Volcanic air pollution, Kilauea Volcano, Hawai`i
Long-lasting Eruption of Kilauea Volcano, Hawai`i Leads to Volcanic-Air Pollution
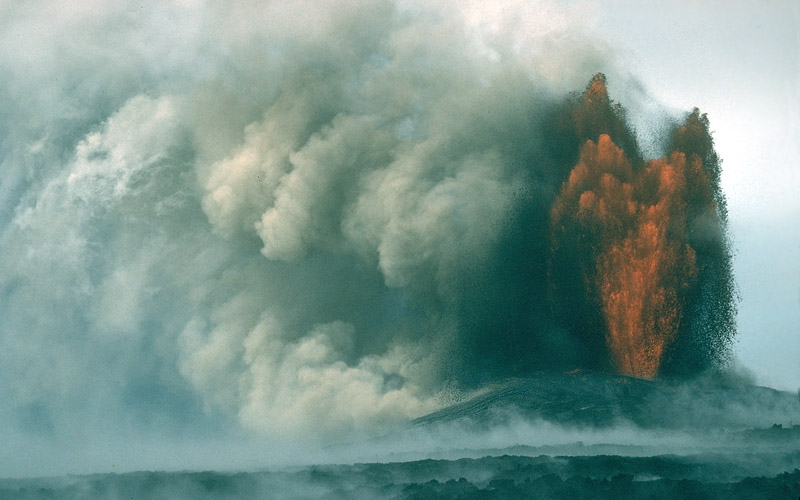
300 m tall Lava fountain, Pu`u `O`o cinder
and spatter cone
Photograph by
J.D. Griggs on March 13, 1985

100 m diameter Lava lake, Kupaianaha vent
Photograph
by J.D. Griggs on November 18, 1986
In 1986 when the eruption of Kilauea Volcano changed from the episodic fountaining of lava and gas at Pu`u O`o cone every few weeks (first image) to the continuous outpouring of lava from a new vent (second image) only 3 km away, the volcano began releasing a large, steady supply of sulfur dioxide gas into the atmosphere. During the episodic activity, enough time elapsed between fountaining episodes for the prevailing trade winds (brisk winds from the northeast of Hawai`i) to blow volcanic gas away from the island. When the eruption style changed, however, the daily release of as much as 2,000 tons of sulfur dioxide gas led to a persistent air pollution problem downwind.
Sulfur dioxide creates vog
SO2 escapes from
Pu`u `O`o
vent
When sulfur dioxide (SO2)gas is released, it reacts chemically with sunlight, oxygen, dust particles, and water in the air to form a mixture of sulfate (S04-2) aerosols (tiny particles and droplets), sulfuric acid (H2SO4), and other oxidized sulfur species. Together, this gas and aerosol mixture produces a hazy atmospheric condition known as volcanic smog or "vog."
Vog creates hazy conditions

Eruption cloud of volcanic gases from Pu`u `O`o
Photograph
by R.W. Decker on March 1, 1983
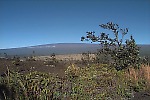
Normal view
Mauna Loa

Vog obscures
Mauna Loa
Strong trade winds blow the eruption cloud from the Pu'u O'o vent toward the southwest and the southern part of the Island of Hawai`i (top left). The cloud consists primarily of water vapor and sulfur dioxide. Note that the cloud rises only a few hundred meters above the ground. The direction and velocity of the prevailing wind largely determine the intensity and general location of vog conditions on the Island of Hawai`i. Vog often accumulates against the southwest flank of Mauna Loa Volcano lower right) during normal tradewind conditions.
Trade winds concentrate vog on leeward side of Hawai`i
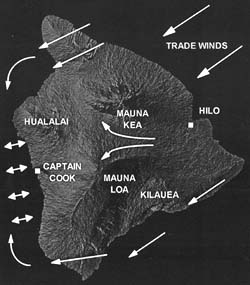
Shaded-relief map of the
Island
of Hawai`i
This digital shaded-relief map shows the usual wind conditions on the island of Hawai`i. Moderate to strong trade winds carry gases and vog from Kilauea Volcano around the southern tip of the island where the gas tends to accumulate on the leeward or "kona" coast. During these usual conditions, vog often becomes trapped by daytime (onshore) and night-time (offshore) breezes (double-headed arrows). During the day, onshore sea breezes carry vog up the slopes of Hualalai and Mauna Loa volcanoes, and into the topographic saddle between Mauna Loa and Mauna Kea. When the landmass cools in the evening, cooler, denser air and vog flow back down to the coast. However, when the trade winds are light or absent or when winds blow from the south, much of the vog stays on the eastern side of the island where it sometimes moves into the city of Hilo.
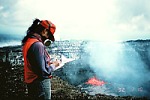
Vog and acid rain affect water quality

Photograph by J.D. Griggs
Many residents on the island of Hawaii depend on rainwater collected by rooftop catchment systems for drinking water. The continuous release of volcanic gases, especially sulfur dioxide, causes rainwater to become acidic downwind of Kilauea's erupting vents. When it falls on roofs, this acid rain leaches lead from roofing nails and paint. The lead-contaminated rainwater then fills the water catchment tanks, creating a health hazard.
1992-1997 SO2 emissions rates from Kilauea Volcano's east rift zone
Averaged SO2 emissions (in metric tons) from Kilauea's east rift zone as measured by vehicle-based COSPEC along Chain of Craters Road, 1992 through 1997. The black vertical bars represent the standard deviation of all traverses on a single day. These measurements have typically provided the best integrated estimate of Kilauea's ERZ SO2 release. Figure is reproduced from Elias, 1998 (see references below). This report is available online.
More about vog
Fact sheet, Volcanic Air Pollution -- A Hazard in Hawai`i
Volcano Watch articles, from the USGS Hawaiian Volcano Observatory
- Vog -- a 1999 owners guide for Big Island Residents, Feb. 1999
- Greenhouse gases in our backyard, Oct. 1998
- Increases in vog may not mean increases in volcanic activity, July 1997
References
Sutton, A.J., Elias, T. Hendley, W. Hendley II, and P.H. Stauffer, 1997, Volcanic Air Pollution -- A Hazard in Hawai`i, U.S. Geological Survey Fact Sheet FS169-97, 2 p.Sutton, A.J., and Elias, T., 1993, Volcanic gases create air pollution on the Island of Hawai`i: U.S. Geological Survey Earthquakes and Volcanoes, v. 24, no. 4, pp. 178-196.
Elias, T., Sutton, A.J., Stokes, J.B., and Casadeval, T.C., 1998, Sulfur dioxide emission rates of Kilauea Volcano, Hawai`i 1979-1997: U.S. Geological Survey Open-File Report 98-462.
