USGS Develops Geophysical Methods to Improve Remediation Monitoring and Site Characterization
U.S. Geological Survey (USGS) scientists continue to develop and adapt new geophysical technologies and data analysis methods for monitoring the performance of remediation systems and for the characterization of contaminated sites. Geophysical monitoring methods are particularly adept at measuring changes in subsurface properties that relate to the presence of water, tracers, contaminants, and injected fluids (steam, bacterial growth promoters, chemical oxidants, . . .). This makes the methods ideally suited to monitor many engineered remediation systems that inject fluids into the subsurface to enhance the biodegradation of contaminants. High-resolution geophysical data provide information that supplements conventional hydrologic tests and water-quality sampling. These non invasive geophysical methods have the potential to provide more cost-effective and reliable information for performance monitoring of remediation strategies and contaminated site characterization. Recent studies include the following four examples:
Tracer Test Monitoring at the Massachusetts Military Reservation, Cape Cod, Massachusetts
USGS and Stanford University scientists used electrical resistivity tomography (ERT) – similar to medical CAT scan techniques – to monitor the subsurface movement of a saline tracer (sodium chloride – salt) in an unconsolidated sedimentary aquifer. Resulting time-lapse geophysical images identified flow paths of tracer transport in the aquifer, indicated contrasts representative of changes in tracer concentration in three dimensions (3-D) through time, and were useful in calibrating a ground-water flow computer model. The ERT results include sixty 3-D snapshots of tracer movement during a 20-day test. The combination of ERT imaging and conventional tracer tests provides a new methodology for understanding aquifer heterogeneity at the field scale.
References
- Singha, K., and Gorelick, S.M., 2005, Saline tracer visualized with electrical resistivity tomography–field scale spatial moment analysis: Water Resources Research, v. 41, no. 5, W05023, doi:10.1029/2004WR003460.
- Singha, K. and Gorelick, S.M., 2006, Effects of spatially variable resolution on field-scale estimates of tracer concentration from electrical inversions using Archie’s law: Geophysics, v. 71, no. 3, p. G83-G91.
More Information
Monitoring Biostimulation Remediation at the Naval Industrial Reserve Ordnance Plant (NIROP), Fridley, Minnesota
USGS scientists used time-lapse borehole radar tomography to monitor a field-scale bioremediation pilot project conducted by the U.S. Navy. A vegetable-oil emulsion was injected to stimulate microbial degradation in areas contaminated by chlorinated hydrocarbons (including trichloroethylene (TCE) and dichloroethylene (DCE)). The radar tomography delineated the spatial distribution and between-well saturation of the vegetable-oil emulsion, and indicated the extent of ground water with altered chemistry. The geophysical monitoring results indicated that the vegetable-oil biostimulant remained close to the three injection wells; however, downgradient total dissolved solids increased after injection, consistent with microbial stimulation and chlorinated hydrocarbon degradation.
References
- Lane, J.W., Day-Lewis, F.D., and Casey, C.C., 2006, Geophysical monitoring of a field-scale biostimulation pilot project: Ground Water, v. 44, no. 3, p. 430-443
Doi 10.1111/j.1745-6584.2005.00134.x
- Lane, J.W., Jr, Day-Lewis, F.D., Versteeg, R.J., and Casey, C.C., 2004, Object-based inversion of crosswell radar tomography data to monitor vegetable oil injection experiments: Journal of Environmental and Engineering Geophysics, v. 9, no. 2, p. 63-77.
- Lane, J.W., Jr, Day-Lewis, F.D., Versteeg, R.J., and Casey, C.C., 2003, Object-based inversion of crosswell radar tomography data to monitor vegetable oil injection experiments, in Proceedings of the Symposium on the Application of Geophysics to Engineering and Environmental Problems (SAGEEP), San Antonio, Texas, Proceedings, April 6-10, 2003: Environmental and Engineering Geophysics Society, CD-ROM, 27 p.
- Witten , A., and Lane, J.W., 2003, Offset vertical radar profiling: The Leading Edge (newsletter by The Society of Exploration Geophysicists), v. 22, no. 11, p. 1070-1076.
More Information Steam-Enhanced Remediation Monitoring at the Former Loring Air Force Base, Limestone, Maine
The USGS used borehole radar tomography and reflection techniques to monitor steam-enhanced remediation of a fractured limestone aquifer contaminated with chlorinated hydrocarbons. The borehole radar results were used to estimate the extent and degree of steam invasion within the aquifer in the vicinity of the radar monitoring wells.
References Grégoire, C., Lane, J.W. Jr., and Joesten, P.K., 2005, Steam injection pilot study in a contaminated fractured limestone (Maine, USA)—Modeling and analysis of borehole radar reflection data, in Proceedings of the 3rd International Workshop on Advanced Ground Penetrating Radar, Delft, The Netherlands, May 2-4, 2005.
More Information
|

Animation of the computed electrical resistivity tomography (ERT) results for the 20-day saline tracer test at the Massachusetts Military Reservation, Cape Cod, Massachusetts. The tomograms show the percent change in subsurface electrical resistivity after injection of a saline tracer. Blue regions indicate a zone of decreased resistivity, representing the location of the saline tracer
(Click on Image to start animation 850K )
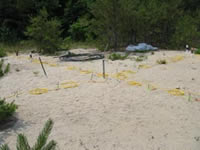
Setup for the electrical resistivity tomography (ERT) that USGS scientists used to monitor the injection of a saline tracer at the Massachusetts Military Reservation, Cape Cod, Massachusetts. The yellow cables are ERT cables. Metal pipes indicate location of sampling sites. Boreholes are encased in white PVC pipes

Borehole radar slowness-difference tomogram between a biostimulant injection well and a downgradient monitoring well, Anoka County Riverfront Park, Fridley, Minnesota. The blue region (increased radar velocity) delineates the region containing the vegetable-oil biostimulant (after Lane and others, 2004).
(Click on Image for a Larger Version)
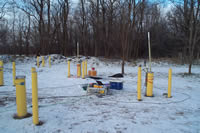
Borehole radar being set up at the Naval Industrial Reserve Ordinance Plant (NIROP), Fridley, Minnesota, field site
(Click on Image for a Larger Version)
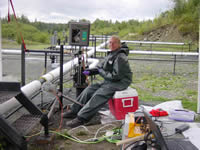
Borehole radar logging at the former Loring Air Force Base, Limestone, Maine
(Click on Image for a Larger Version)
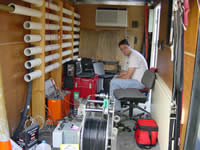
USGS scientist processing preliminary borehole radar data inside a trailer used to house borehole radar equipment. White pipes on the left are for antenna storage
(Click on Image for a Larger Version)
|
Linking Geophysics and Hydrologic Characterization
Geophysical tomography methods are used increasingly to help estimate hydrologic properties in sedimentary and fractured-rock aquifers. In an effort to strengthen the link between geophysical and hydrogeologic characterization, USGS scientists investigated the effect of measurement resolution on the ability to use geophysical tomograms to estimate hydrologic parameters (for example, porosity, solute concentration, water content). Using a new modeling approach, it is possible to predict and quantify the loss of information (blurring and streaking) in tomography. ERT performs well near the boreholes, but produces smoothed out estimates in the interwell region; in contrast, radar performs well in the middle of the tomogram but poorly at the boreholes. Thus, ERT and radar can provide complementary information about hydrologic properties between boreholes.
References
- Day-Lewis, F.D., and Lane, J.W., Jr., 2004, Assessing the resolution-dependent utility of tomograms for geostatistics: Geophysical Research Letters, v. 31, L07503, doi:10.1029/2004GL019617, 4 p.
- Day-Lewis, F.D., Singha, K., and Binley, A.M., 2005, Applying petrophysical models to radar travel time and electrical-resistivity tomograms–resolution-dependent limitations: Journal of Geophysical Research, v. 110, B08206, doi:10.1029/2004JB005369, 17 p.
More Information
General Information on Geophysical Methods Research
Related Headlines
Back to Headlines Page
|

|


