| U.S. Department of Labor | |
|||||
| Occupational Safety & Health Administration | ||||||
«« Back to the DEP Target Industry Profiles Page |
|||||||||||||||||||||||||||||
| Profile: Public Warehousing and Storage |
|||||||||||||||||||||||||||||
Office of General Industry Enforcement Table of Contents
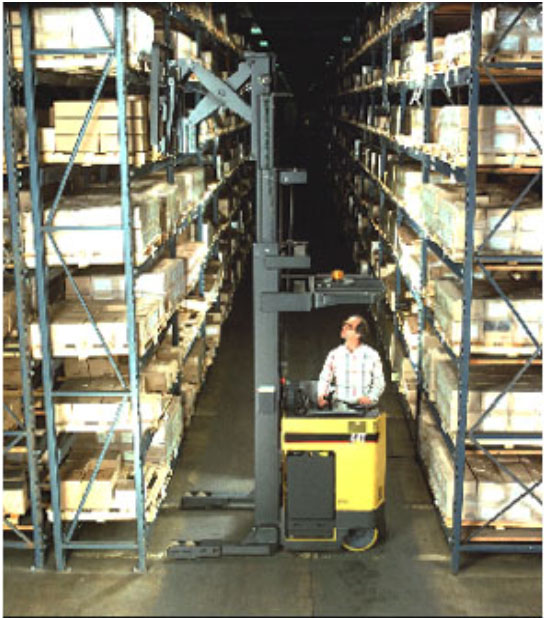
Industry Group 422 - Public Warehousing and Storage Industry Description: Public warehousing and storage includes establishments engaged in the warehousing and storage of farm products, SIC 4221; perishable goods under refrigeration, SIC 4222; general line of goods, SIC 4225; and special products, not elsewhere classified, SIC 4226. Process Description: A fleet of trucks of various sizes is often required for delivery to and from the warehouse. Materials for storage are unloaded at the docks and placed in designated areas. Length of storage time ranges from a day to years. Items stored may include farm products such as beans, cotton, grains, potatoes, tobacco and wool. Special types of warehousing may also be used for automobile storage, fur storage, lumber terminals, oil and gasoline storage, petroleum and chemical bulk stations and terminals as well as for textiles and liquor. Refrigerated warehouses may store any type of perishable goods and some furs. Also included are food lockers, which may or may not provide services for processing, preparing, or packaging such food for storage. Materials are moved by either hand or mechanical handling equipment (forklifts, etc.) to storage bays or racks or refrigerated rooms. BLS Profile
|
|||||||||||||||||||||||||||||
| Lost Workday Case Rate (Industry Group - 422) | |||||||||||||||||||||||||
|
 |
||||||||||||||||||||||||
| Cases with Days Away Rate (Industry Group - 422) | |||||||||||||||||||||||||
|
 |
||||||||||||||||||||||||
| National Summary by Region |
|||||||||||||||||||||||||||||||||||
| NAICS 4931 | |||||||||||||||||||||||||||||||||||
|
|||||||||||||||||||||||||||||||||||
| Average Case and Demographic Characteristics | |||||||||||||||||||||||
|
|||||||||||||||||||||||
| Source: OSHA Office of Statistical Analysis compilation of BLS data Note: The percentages on this table do not sum to 100%. Only the most frequently coded characteristics are listed. The "All Other" category should not be interpreted as being all inclusive of the categories not listed above. |
|||||||||||||||||||||||
| Inspection Summary FY 2004 Federal OSHA Inspection Data Industry Group 422 |
||||||||||||||||||||||||||||||||||||
|
||||||||||||||||||||||||||||||||||||
| Source: IMIS Database |
| Top 10 Violations Cited | ||||||||||||||||||||||||||||||||||||||||||||||||
|
||||||||||||||||||||||||||||||||||||||||||||||||
| Some Potential Hazards and Their Sources | ||||||||||||||
|
| 2003 BLS Industry Data for Industry Group 422 - PUBLIC WAREHOUSE AND STORAGE |
| All Reported Cases | 14190 |
|
| Nature of Illness or Injury Sprains, Strains Fractures Cuts, Punctures Bruises Heat Burns Chemical Burns Amputations Carpal Tunnel Tendonitis Mult Trauma Total Mult Trauma With Fracture Mult Trauma With Sprain Back Pain Total Back Pain Hurt Back Only All Other |
Number 6630 1010 970 1400 N/A N/A 40 200 160 580 50 310 1020 380 2130 |
% Total 46.7 7.1 6.8 9.9 N/A N/A 0.3 1.4 1.1 4.1 0.4 2.2 7.2 2.7 15.0 |
| Part of Body Affected Head Total Eyes Neck Trunk Total Trunk Back Trunk Shoulder Upper Extremities Total Upper Extremities Finger Upper Extremities Hand Upper Extremities Wrist Lower Extremities Total Lower Extremities Knee Lower Extremities Foot Toe Body Systems Multiple Body Parts All Other Body Parts |
Number 820 580 230 5690 3630 1030 3070 1050 670 620 3010 980 820 100 1160 120 |
% Total 5.8 4.1 1.6 40.1 25.6 7.3 21.6 7.4 4.7 4.4 21.2 6.9 5.8 0.7 8.2 0.8 |
| Source of Injury or Illness Chem And Chem Products Containers Furniture And Fixtures Machinery Parts And Materials Worker Motion Floors Walkways Handtools Vehicle Health Care Patient All Other Sources |
Number 140 4820 750 770 640 1920 1820 430 1810 N/A 1080 |
% Total 1.0 34.0 5.3 5.4 4.5 13.5 12.8 3.0 12.8 N/A 7.6 |
| Sex Men Women Sex Not Reported |
Number 11030 3160 N/A |
% Total 77.5 22.3 N/A |
| Age Under 14 14 to 15 16 to 19 20 to 24 25 to 34 35 to 44 45 to 54 55 to 64 65 And Over Not Reported |
Number N/A N/A 580 2070 4000 3610 2540 920 70 400 |
% Total N/A N/A 4.1 14.6 28.2 25.4 17.9 6.5 0.5 2.8 |
| Race White Black Asian American Indian or Alaskan Native Native Hawaiian or Pacific Islander Hispanic or Latino or Other Multirace Not Reported |
Number 5240 1250 90 150 N/A N/A N/A 5350 |
% Total 36.9 8.8 0.6 1.1 N/A N/A N/A 37.7 |
| Length of Service Less Than 3 Months 3 to 11 Months 1 to 5 years More Than 5 Years Service Not Reported |
Number 1740 3340 5380 3720 N/A |
% Total 12.3 23.5 37.9 26.2 N/A |
| Days away from work 1 Day 2 Days 3 to 5 Days 6 to 10 Days 11 to 20 Days 21 to 30 Days 31 Days Or More Median Days Away |
Number 1990 1320 2380 1570 1940 980 4020 10 |
% Total 14.0 9.3 16.8 11.1 13.7 6.9 28.3 N/A |
| Event/Exposure Leading to Injury Total Contact With Objects Struck By Object Struck Against Object Caught In Object Fall to Lower Level Fall On Same Level Slips Or Trips Overexertion Total Overexertion In Lifting Repetitive Motion Exposure to Harmful Substance Transportation Accidents Fires And Explosions Total Assaults - Violent Acts Assaults by Person All Other Assaults All Other Events |
Number 4120 2020 850 960 500 1580 230 4780 3010 630 260 720 N/A 20 20 N/A 1350 |
% Total 29.0 14.2 6.0 6.8 3.5 11.1 1.6 33.7 21.2 4.4 1.8 5.1 N/A 0.1 0.1 N/A 9.5 |
| |
www.dol.gov | |
| Contact Us | Freedom of Information Act | Customer Survey Privacy and Security Statement | Disclaimers |
||
| Occupational Safety & Health Administration 200 Constitution Avenue, NW Washington, DC 20210 |
||