|
america's dynamic workforce: 2006 |
Diverse indicators highlight the strengths of the U.S. economy
and labor market. The successful record of the United States across a
broad range of indicators and over an extended time period is remarkable
for a mature industrial economy.
The fact that the United States has achieved these results in
the face of growing world-wide competition and other challenges, both natural
and man-made, is a further testament to the robustness and resilience of an
economic system based on free and open markets. High and growing output per
capita, growing employment, high labor force participation rates and
employment-population ratios, strong productivity growth and low unemployment
relative to other nations reflect the energy, creativity, skills, flexibility
and competitiveness of American workers and employers
-
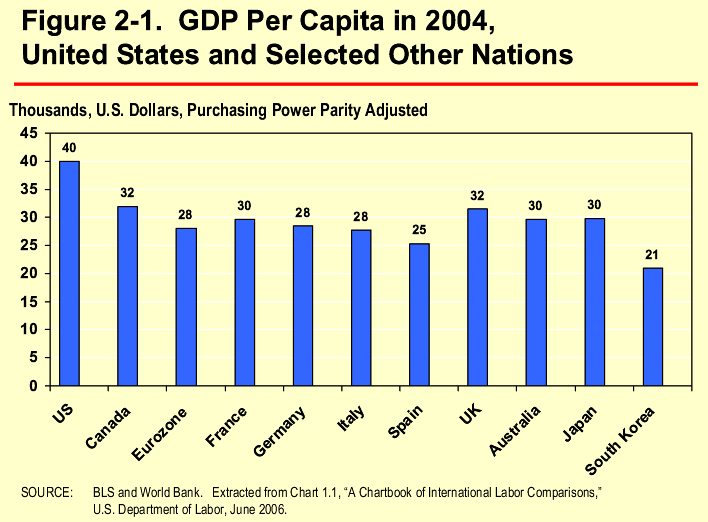
The strength and
productivity of American workers are reflected in high per capita
output. U.S. per capita gross domestic product (GDP) was $39,900 in
2004, the most recent year for which broad international comparisons
of per capita GDP can be made on a purchasing power adjusted basis.
- Among
member countries of the Organization for Economic Cooperation and
Development (OECD), the United States ranked near the top in terms of GDP
per capita. Only Luxembourg, Norway, and Ireland (not shown in the figure)
had higher per capita GDP. Among large major economies, U.S. per capita GDP
was more than 20 percent higher than that of Australia or Canada.
- Among the largest members of the European Monetary Union (Eurozone), per
capita GDP ranged from $25,300 in Spain to $29,600 in France.[9]
Overall, U.S. per capita GDP was 34 percent higher than in Japan.
-
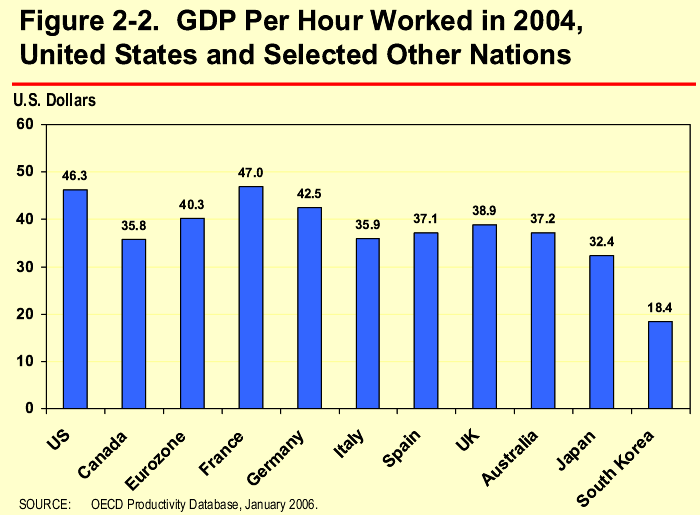
Underlying the United States’ high per capita GDP is our dynamic,
productive workforce. On average, each hour on the job contributed
$46.30 to domestic output. Among the large, major economies shown,
only France achieved greater GDP per hour worked ($47 per hour), but
lower effort resulted in lower per capita output for France compared
to the United States.
-
Other
Eurozone countries exhibited less efficiency, and the Eurozone as a whole
had an average GDP per hour of $40.30 in 2004. Indeed, a number of European
economies, as well as Canada and Australia, posted figures more than $10.00
per hour lower than the U.S. figure.
-
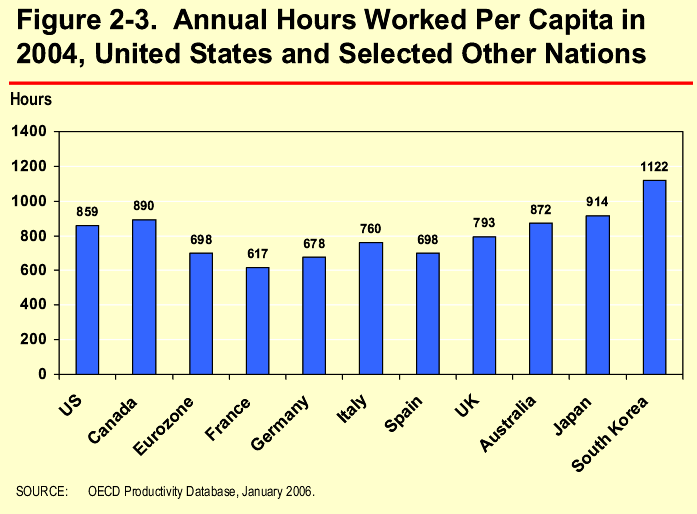
Hours worked per capita is a single measure of the labor activity
across the population – taking into account both the proportion of
the population that is employed and the number of hours people
work. In 2004, per capita hours worked totaled 859 hours, placing
the United States in the same neighborhood as Australia and Canada.
-
South Korea easily surpassed these countries by posting 1,122 hours
per capita. The gap reflected the 2,394 hours an average South
Korean employee worked per year in 2004; in contrast, an average
U.S. worker worked 1,808 hours.
- On the
flip side was France’s relatively low hours per capita. Here lies the
difference between per capita GDP in the United States and France. In broad
terms, the two countries’ workers are similarly productive, but the French
simply work fewer hours.
-
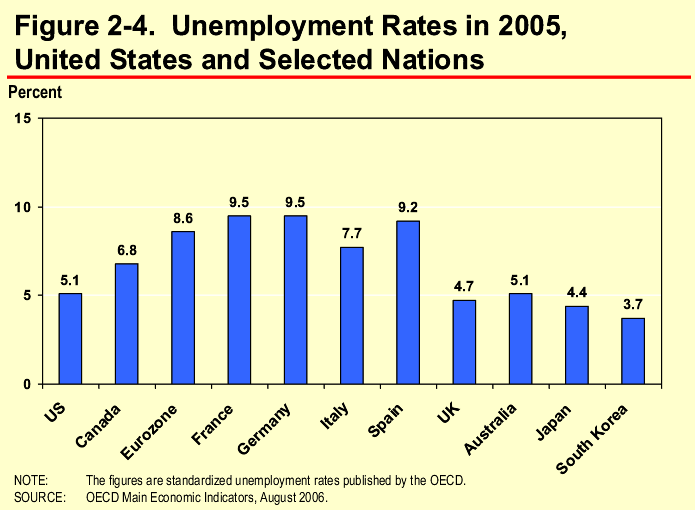
At 5.1 percent, the U.S. unemployment rate in 2005 was well below
that of most of its European peers. Both Japan and South Korea
benefited from even lower rates, continuing long-term trends for
both countries.
-
The United Kingdom’s unemployment rate has hovered around 5 percent
for several years, after trending down from over 10 percent in
1993. The U.S. unemployment rate edged down further by mid-2006.
In May, it reached a nearly 5-year low of 4.6 percent.
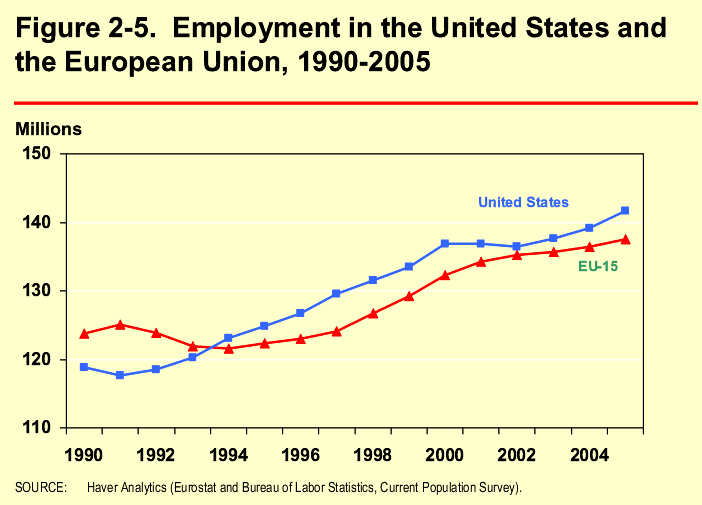
- The labor markets of both the United States and the European Union
(EU-15) are quite similar in size and make for interesting
comparisons.[10] Between
1990 and 2005, civilian employment in the United States rose 19.3
percent, while the comparable measure for the EU-15 rose 11.1
percent. Employment clearly has increased in both areas, but the
EU-15 has outpaced the United States in employment growth for only
five of the past 15 years, most notably during and after the last
two U.S. recessions, 1990-91 and 2001.
- Since 2003, the United States again has taken the lead, while a number of European
countries have seen somewhat stagnant employment growth, most notably France
and Germany.
- Like much of Europe, Japan has experienced poor employment growth in recent
years. Japan saw six consecutive years of employment declines between 1997
and 2003. The subsequent recovery has boosted employment only slightly.
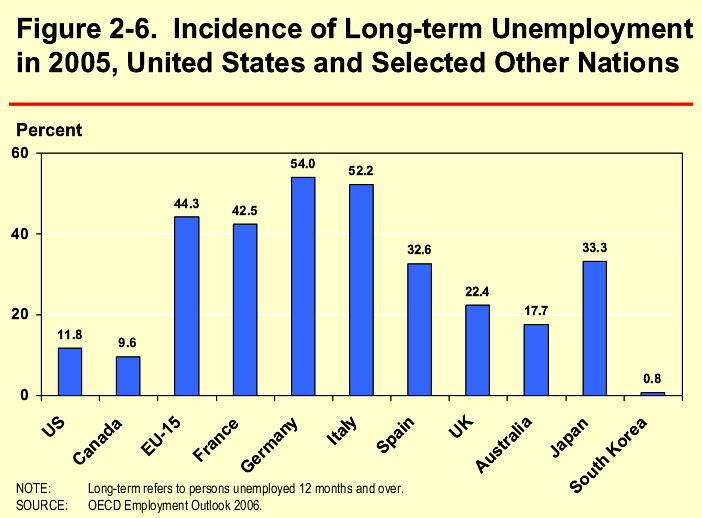
- In addition to tepid job growth, a common thread between Japan and Europe
is the incidence of long-term unemployment, defined as a spell of
unemployment lasting at least 12 months. In Japan, the long-term
unemployed account for one-third of the total in 2005; in the European
Union, the figure was over 44 percent. Even the United Kingdom’s share
doubled the roughly 12 percent seen in the United States.
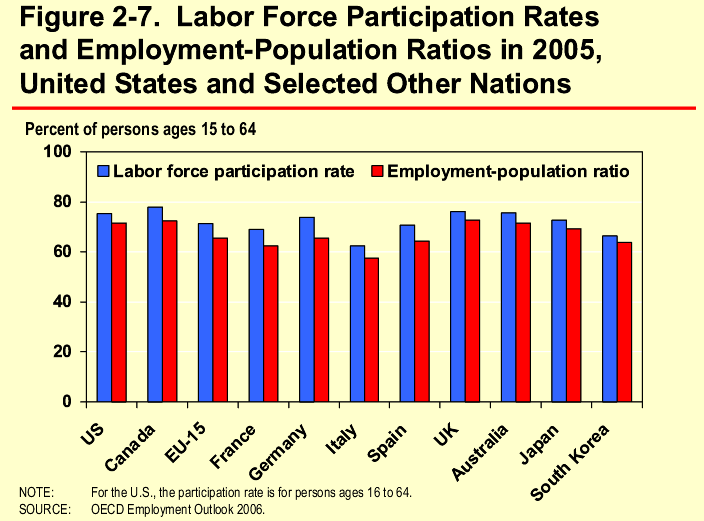
-
The U.S. labor force participation rate, 75.4 percent (for ages
16-64) was somewhat higher than the 71.3 percent registered in the
European Union (for ages 15.64).
-
In terms of the employment-population ratio, there were only minor
differences between the United States and other countries with low
unemployment rates. The United States, Canada, United Kingdom,
Australia, and Japan all had employment-population ratios in the
neighborhood of 70 percent. The notably lower percentages for South
Korea reflect its relatively low labor force participation rates.
For the major European economies (excluding the United Kingdom), the
reduced employment-population ratios reflect their elevated
unemployment rates as well.
|


