

 Climate Monitoring / Climate of 2005 / Annual Summary / U.S. Climate / Help Climate Monitoring / Climate of 2005 / Annual Summary / U.S. Climate / Help

|
|
2005 was the 13th warmest year on record for the U.S. with a nationally averaged temperature of 54.0°F (12.2°C). This is 1.2°F (0.7°C) above the 1895-2004 mean. The year was near the long-term mean for precipitation for the nation. |
   |
The last five 5-year periods (2001-2005, 2000-2004, 1999-2003, 1998-2002, 1997-2001), were the warmest 5-year periods (i.e. pentads) in the last 111 years of national records, illustrating the anomalous warmth of the last decade. The 6th warmest pentad was in the 1930s (1930-34), when the western U.S. was suffering from an extended drought coupled with anomalous warmth. The warmest year on record for the U.S. was 1998, where the record warmth was concentrated in the Northeast as compared with the Northwest in 1934. Seasonal Analysis: The temperature for the 2004-2005 winter season (Dec-Feb) was warmer than average for the nation (12th warmest out of 110 years), with much warmer than average temperatures in parts of the Rockies and northern Plains. Spring (March-May) was near average (55th coldest, 57th warmest out of 111 years of records) for the nation with much below average temperatures along the Eastern Seaboard balancing warmer conditions in the Northwest. Summer (June-August) was warm across much of the nation and ranked 17th warmest in 111 years of national records, with the majority of the northeastern U.S. much warmer than average. The Northeast as a whole had its 2nd warmest summer on record, with New Jersey and New Hampshire averaging record warm for the season. The 2005 fall season (September-November) was 4th warmest on record, with all but 3 contiguous states having above average warmth. |
|
More details of individual monthly and seasonal reports for 2005 can be found in NCDC's monthly and seasonal reports. |
 |
The adjacent figure shows the percentage of the contiguous U.S. that was very warm and the percentage that was very cold during each of the past 48 months. In 2005, only one month (May) averaged very cold over 10% or more of the country, with April at just under 5%. Over 10% of the U.S. was very warm for seven months in 2005, while over 20% of the country was very warm in 4 months, (July, August, September, and November), with September averaging over 50% of the nation in the very warm category. Very warm and very cold conditions are defined as the warmest and coldest ten percent of recorded temperatures, respectively. |
2005 Statewide Analysis:
| 2005 was much warmer than average for 17 states, including Minnesota, which was 5th warmest on record. A further 26 contiguous states were warmer than average, and only 5 southeastern states remained near average for 2005. |
 |
 |
Annual temperatures averaged across the state of Alaska in 2005 placed 6th warmest since 1918 - the 6th consecutive above-average year for the state, which is unprecedented in the historical record. Alaska had another warm summer in 2005 (3rd warmest on record) following the record warm summer of 2004. The summer warmth coupled with anomalous dryness in parts of the state also contributed to an active wildfire season for Alaska. |
| Data collected by NOAA's TIROS-N polar-orbiting satellites and adjusted for time-dependent biases by NASA and the Global Hydrology and Climate Center at the University of Alabama in Huntsville, indicate that temperatures in the lower half of the atmosphere (lowest 8 km of the atmosphere) over the U.S. were warmer than the 20-year (1979-1998) average for the 8th consecutive year. 2005 ranks as the 6th warmest year since this satellite record began in 1979. |  |
 National Precipitation
| Precipitation in the United States in 2005 was variable throughout much of the country with periods of excessive rainfall, especially in the Southwest and Northeast, and persistent and developing drought in other areas. Winter storms in the Southwest led to record or near-record seasonal precipitation for much of the region, while the fall was record wet for the Northeast. Severe drought affected the Northwest during the 2004-2005 winter, however the drought situation was significantly improved with abundant spring precipitation. The southern Plains to the Great Lakes had severe moisture deficits from the spring through the fall. Twenty-four states were wetter than average from January-December, including 9 states that were much above average and 2 states that were record wet. Ten states were drier than average including Arkansas, which had its second driest year on record. Nationally, it was near the long-term mean, ranking 49th wettest year on record.
|
| Below average rain and snowfall occurred in parts of the South, southern Great Lakes and the Pacific Northwest during 2005. This dearth of precipitation in the Northwest during the winter months, led to severe drought conditions across the region, with the main storm track remaining south and bringing excessive moisture to the Southwest (see below). Some drought relief came during the spring, with above average rain and late-season snow. Drought developed in the central US during the spring and into the fall leading to extreme drought in parts of the southern Great Plains and in the southern Great Lakes. See the NCDC annual drought summary for more information. A series of major Pacific winter storms contributed to the moisture in the Southwest in 2005, with Los Angeles having its wettest (37 inches) water year (Oct-Sep) in 121 years and 2nd wettest water year on record. Rainfall for the city totaled 16.97 inches from December 27th 2004-January 10th 2005, making it the wettest 15 days on record for Los Angeles. The storms acquired moisture from the warm central Pacific Ocean before reaching the coast and mountains of the Southwest. The Northeast also had extreme precipitation for fall 2005, with 9 states (New Jersey and Delaware to Maine) having record rain and snowfall for October and 2 states (Maine and New Hampshire) having record precipitation for the year. Over 17 inches of rain fell at Millbrook, NY during October. Some of the October rainfall in the Northeast came from the remanants of two tropical systems (Tropical Storm Tammy and Hurricane Wilma). More information about significant precipitation events can be found on NCDC's annual summary of significant events page. |
   |
|
 |
The adjacent figure shows the percent of the contiguous U.S. that was very wet and the percent that was very dry during each of the past 48 months. During 2005, more than a tenth of the country was very dry in 7 months (February, May, July, September, October, November and December). For 8 months, the percent area of very wet conditions exceeded ten percent, also exceeding 15% for 4 months (January, February, May, and June). |
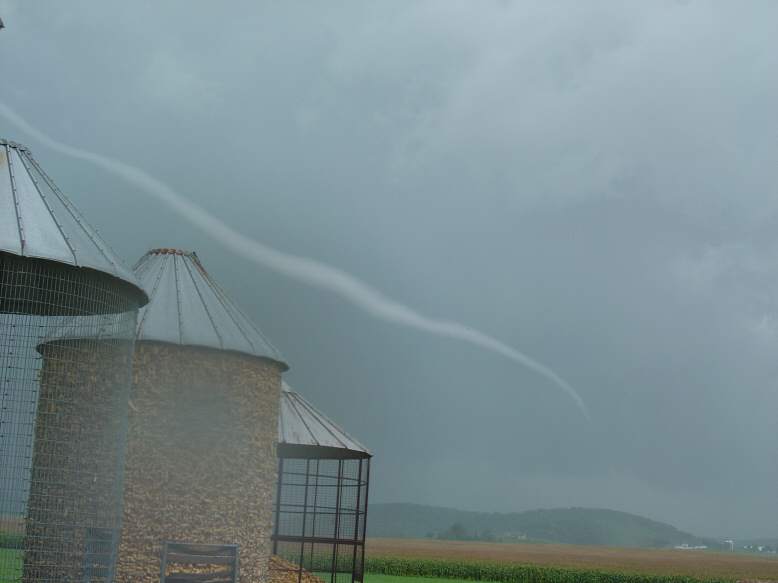
Severe Storms| Preliminary estimates indicate there were only 9 very strong to violent tornadoes (wind speeds in excess of 158 mph, category F3-F5 on the Fujita Scale) during the 2005 official tornado season (March-August). This is significantly below the 1971-2000 mean of 37. A slight negative trend in very strong to violent tornadoes has been observed since 1950. There were no F4 or F5 tornadoes during the main tornado season - all 9 major tornadoes were F3 intensity. |
|
There were several notable storm outbreaks in 2005. These included an outbreak of severe weather across Mississippi and Louisiana in April that led to reports of over 30 tornadoes. Tornadoes occurred in Wisconsin in June, one of which ripped through the town of Hammond, causing over $3 million in damage. Again, in August, in Wisconsin and also in Wyoming, severe thunderstorms generated tornadoes killing at least 3 people. Tornadoes also touched down across parts of the central US in September as thunderstorms moved across the area between Oklahoma and Wisconsin. A relatively late storm outbreak occurred across parts of the Midwest in November, with 23 fatalities in Evansville, Indiana on November 6th. More severe weather impacted the same region on November 15th with over 30 tornadoes reported. Although the peak months for tornadoes are April-June for the U.S., outbreaks of severe weather are not uncommon in November as the seasonal transition can provide atmospheric conditions similar to those in spring. |
The annual summary of significant events describes these outbreaks and other severe weather for the nation over the year. NCDC's monthly pages contain additional details and graphics for each month. |
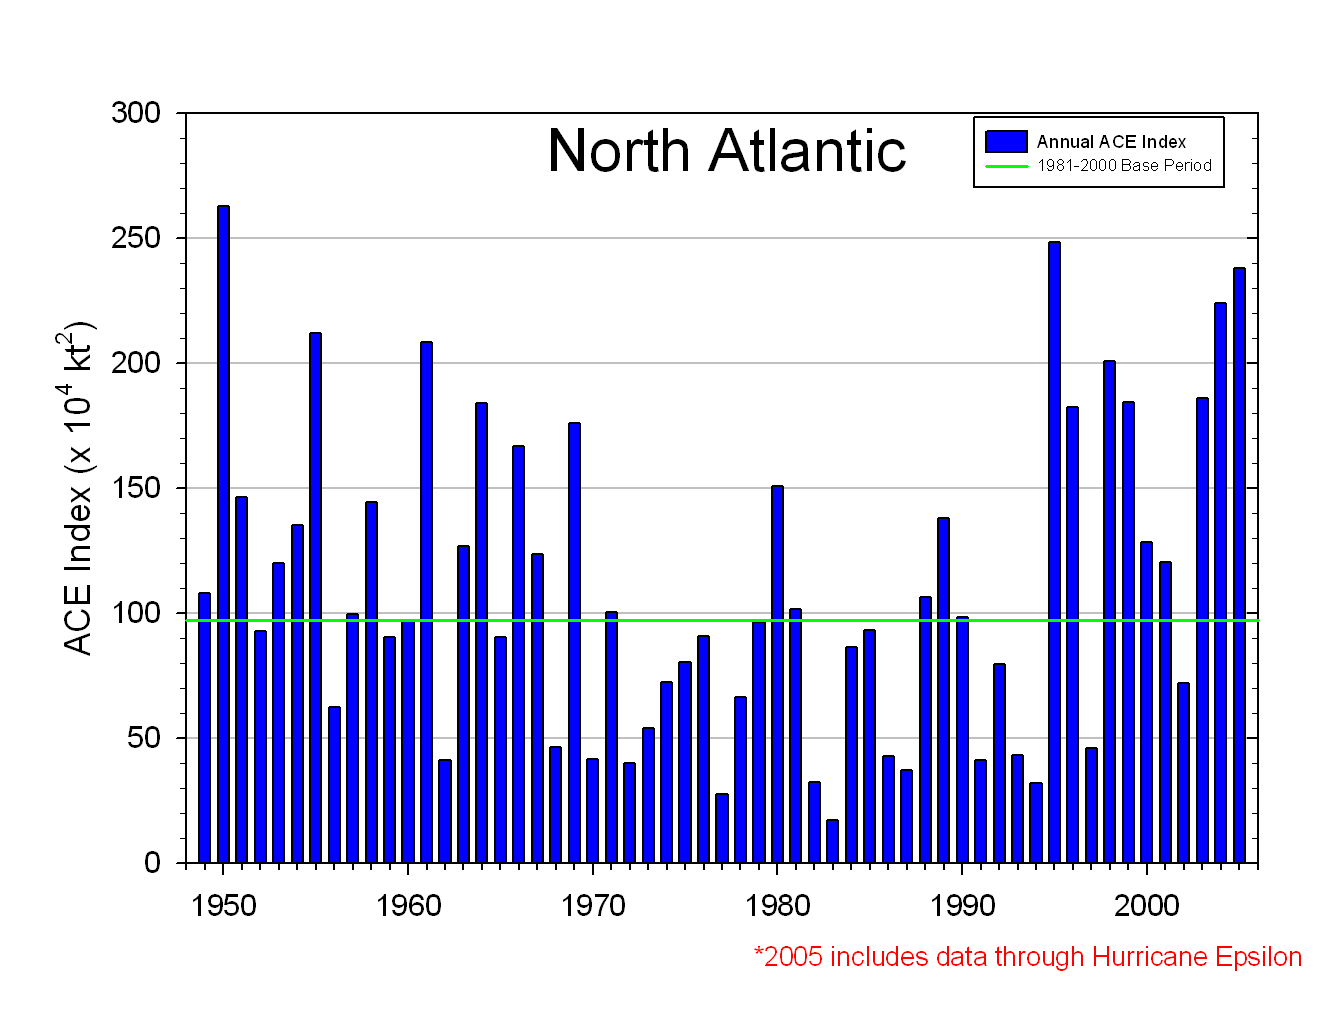
Atlantic Hurricanes The Atlantic Basin had a record active season in 2005 with 27 named storms, of which 15 were hurricanes, including 7 major hurricanes. Of the 7 major hurricanes, an unprecendented 4 reached category 5 status. The average (based on data from 1944-1996) is approximately 10 named storms, of which 6 are hurricanes, including 2-3 major hurricanes. The ACE index of hurricane activity also indicates a significantly above average season - the 3rd most active on record, with a preliminary value of approximately 240 x104 knots2. An average season is anywhere from 66 x 104 knots2 to 103 x 104 knots2. |
| Hurricane Katrina, which was one of the most costly storms in US history, made landfall in August. At one stage a category 5 hurricane, Katrina ultimately made landfall in Louisiana and Mississippi at category 3 strength. While loss of life does not approach the magnitude of the Galveston Hurricane of 1900 (6000-12000 deaths), it nonetheless caused more than 1300 deaths and will likely cost more than 100 billion dollars - by far the highest cost of any hurricane in history. A web page and a technical summary of Katrina is available. |

|
|
Other hurricanes that impacted the US coast in 2005 were Hurricanes Cindy and Ophelia and major Hurricanes Rita, Wilma, and Dennis, with Hurricane Emily making landfall in Mexico and producing rain in Texas. More details about these and all the 2005 Atlantic tropical systems can be found on NCDC's hurricane page |
Snow Season
Global Snow Lab 
|
The 2004/2005 snow season was generally above average across the Southwest and much below average across the northern Rockies and Pacific Northwest. Snow cover was slightly below average for the North American continent as a whole over the winter and much below average for the spring, consistent with a trend towards reduced spring snow cover for North America as shown in the adjacent image. Notable snow storms in 2005 include a major winter storm, referred to as the 'Blizzard of 2005', in January that affected the Northeast and produced well over a foot of snow across much of southern New England. Boston had its snowiest January on record partly as a result of that storm and NCDC's Northeast Snowfall Impact Scale ranked the January snow storm as the 7th most intense on record. Heavy snow produced over 2 feet of accumulation in the mountains around Denver, CO in April and a significant snow storm affected the Midwest early in the 2005/06 winter, with 16-20 inches of snow accumulating across parts of Nebraska and the Dakotas in November. More details of these and other snow and ice events are available in the annual summary of significant events. Snowpack in the West was much above average for the Southwest and much below average for the Northwest in the 2004/2005 winter. The multiple storm systems that brought rain to the coastal and desert Southwest, also brought abundant snow to the Sierra Nevada and central and southern Rocky mountains. With the storm track remaining to the south, the Northwest snowpack failed to develop as normal and measured less than 50% of normal by the end of winter across large parts of the region. The Northwest relies on melting winter snow to replenish reservoirs. Spring precipitation eased drought conditions in the Northwest. |
| More details on snow across the US and the globe can be found on the 2004-2005 snow and ice page and the 2005-2006 snow and ice page. |
|
More details of weather and climate in individual months and seasons in 2005 can be found on NCDC's monthly pages
|
| NOAA's National Climatic Data Center is the world's largest active archive of weather data. The preliminary temperature and precipitation rankings are available from the center by calling: 828-271-4800. NOAA works closely with the academic and science communities on climate-related research projects to increase the understanding of El Niño and improve forecasting techniques. NOAA's Climate Prediction Center monitors, analyzes and predicts climate events ranging from weeks to seasons for the nation. NOAA also operates the network of data buoys and satellites that provide vital information about the ocean waters, and initiates research projects to improve future climate forecasts. |
|
For further information, contact:
NOAA/National Climatic Data Center 151 Patton Avenue Asheville, NC 28801-5001 fax: 828-271-4328 email: Jay.Lawrimore@noaa.gov |
Climate Monitoring / Annual Summary / U.S. Climate / Help


