Physical Activity Guidelines Advisory Committee Report
Part D. Background
List of Figures
List of Tables
Introduction
Over the past 35 years, various health associations and agencies in the
United States have published guidelines or recommendations for health
professionals and the public regarding the health benefits and risks of being
physically active. The rationale for these publications was that on the one
hand, many people were insufficiently active and needed guidance on why and how
to become more physically active, but on the other hand, an increase in
physical activity by inactive adults posed significant health risks so medical
guidance was needed. To determine how well various segments of the population
are meeting these guidelines, national public health surveillance systems have
been implemented by agencies within the US Department of Health and Human
Services (HHS). The data collected by these surveillance systems over the past
decade have indicated that many youth, adults, and older adults fail to meet
these recommendations and that the rate of compliance varies substantially by
sex, age, educational achievement, socioeconomic status, and race/ethnicity.
These results are a major reason for an increased emphasis on developing
federal physical activity and public health guidelines and policy statements.
In addition, a majority of the questions now being asked about physical
activity and health relate more to the dose (type, amount, and intensity) of
activity that conveys health benefits in specific populations than to whether
or not there are benefits from being physically active. Thus, it is important
for the review of the science and the development of physical activity
guidelines to carefully consider issues of dose response. This Background
addresses all of these issues by discussing several key issues related to dose
response, presenting an overview of the recent trends in physical activity by
Americans, and outlining the history of physical activity and health
recommendations and guidelines in the United States.
Some Issues Regarding Dose Response
Developing physical activity recommendations for public health would be
quite easy if simply stated answers could be given to such questions as, "How
much activity do I need to be healthy?" or "How much more benefit do I get if I
walk 30 minutes 6 times per week verses just 3 times per week?" Unfortunately
that does not appear to be the case. To provide an appropriate answer to such
questions, a number of issues need to be considered, including a person's
current physical activity status, fitness level, health status, age, sex, and
major health and fitness goals. Genetic differences among individuals also
influence their responsiveness to a specific dose of activity. All of these
issues affect any improvements in health and fitness that may come from
increases in various combinations of type, intensity, duration, and frequency
(the main components of dose).
The Process of Adaptation
Some of the body's structures and functions favorably adapt to the
increase in demands placed on them whenever physical activity of a greater
amount or higher intensity is performed than what is usual for the individual.
It is these adaptations that are the basis for much of the improved health and
fitness associated with increases in physical activity. This increase in
activity is called overload and if applied correctly, will improve the
capacity and/or efficiency of various tissues and systems. For example, cardiac
stroke volume and skeletal muscle capillary density are enhanced in response to
an increase in aerobic or endurance activity. Many different combinations of
the main components of dose can achieve this overload. However, too big an
overload applied too quickly can cause fatigue and contribute to injury.
Therefore, the overload needs to be applied progressively in relatively small
increments to allow for the body to adapt before receiving an even greater
overload. This concept is called progression. The nature of the
adaptation, also called specificity, that occurs in response to a
progressive overload is influenced by the type of activity being performed. If
the overload is produced by aerobic activities like walking, jogging, cycling
or swimming, adaptations occur more to the oxygen transport system and various
metabolic processes than if the activity is a resistance activity, such as
weight lifting, which produces greater changes in muscle strength and mass.
Understanding these three principles of the biological responses to activity
– overload, progression, and specificity – helps in addressing issues
about dose response to activity.
The Baseline Level of Physical
Activity
The baseline level of habitual physical activity as well as the exercise
capacity (physical fitness) of a person needs to be accounted for when
considering an increase in physical activity. In other words, it is important
to create an overload but not an excessive amount of overload. Therefore, for a
person who has been sedentary for some time for whatever reason, the initial
dose of activity should be at a relatively low intensity, of limited duration,
with the sessions (also called bouts) spread throughout the week. An example of
this approach would be a walking program with sessions of 5 minutes of slow
walking, 5 to 6 days per week, with the bouts performed at various times
throughout the day (e.g., 3 times per day). As the person adapts to this amount
of activity, the bout duration could be slowly increased to 10 minutes, and as
exercise capacity begins to increase, the walking speed could be increased.
Such an approach is based primarily on expert opinion and clinical experience,
as the benefits and risks of various approaches to initiating and progressing
an activity program for very sedentary or unfit persons have not been
systematically evaluated.
Another issue regarding baseline levels of physical activity is the
apparent gradual decline in the recent decade in "routine physical activity"
for an increasing proportion of the US population. Unfortunately, in the United
States and other developed or developing countries, accurate data are not
available on time trends for the total amount of physical activity performed
throughout the day (energy expenditure for activities of daily living). Recent
reports from objective measures of physical activity using accelerometers for 7
days provide some cross-sectional data on the US population. The results show
that a far higher proportion of the population is inactive than has been
indicated from self-reported estimates of physical activity (1;2). Very similar data have been reported
for adults in Sweden using similar technology (3). We still
need to better understand how the results of physical activity assessment by
new objective measurement methods that can be applied to large populations
compare to data collected by commonly used questionnaires. If the time spent
being physically inactive is continuing to increase among the US
population, it may be that the starting dose of activity will need to be
adjusted downward to accommodate more people with lower exercise capacities. At
the same time, the amount of activity that will have to be added to this lower
baseline to return people to being physically active by current day standards
will have to be increased.
Physical Activity Intensity
Intensity is a key factor when considering the dose of physical activity
required to achieve specific health and fitness outcomes. Not only does an
increase in activity intensity play a major role in producing many favorable
adaptations, but it also has a key role in the risk of injury during activity.
In most of the studies reviewed for this report, the intensity of physical
activity was expressed either in absolute or relative values.
Absolute intensity refers to the energy or work required to perform
the activity and does not take into account the physiologic capacity of the
individual. For aerobic activity, absolute intensity may be expressed
as the rate of energy expenditure (e.g., kilocalories per minutes, multiples of
resting energy expenditure [METs]) or, for some activities, simply as the speed
of the activity (e.g., walking at 3 miles per hour, jogging at 6 miles per
hour). For resistance exercise, absolute intensity is expressed as weight
lifted or force exerted (e.g., pounds, kilograms). Absolute intensity also can
be classified into categories such as light, moderate, hard, and very hard (Table D.1).
Table D.1. Classification of Physical
Activity Intensity
Endurance Type Activity — Relative Intensity
|
Intensity |
Percent
VO2R*
Percent
HRR |
Percent
HRmax¥ |
RPE† |
|
Very Light |
<20 |
<50 |
<10 |
|
Light |
20-39 |
50-63 |
10-11 |
|
Moderate |
40-59 |
64-76 |
12-13 |
|
Hard |
60-84 |
77-93 |
14-16 |
|
Very Hard |
≥85 |
≥94 |
17-19 |
|
Maximal |
100 |
100 |
20 |
Table D.1. Classification of Physical Activity Intensity
(continued)
Endurance Type Activity — Intensity (METs and %VO2max)
in Healthy Adults Differing in VO2max
|
Intensity |
VO2max =
12 METs
METs |
VO2max =
12 METs
Percent
VO2max** |
VO2max =
10 METs
METs |
VO2max =
10 METs
Percent VO2max |
VO2max =
8 METs
METs |
VO2max =
8 METs
Percent
VO2max |
VO2max =
5 METs
METs |
VO2max =
5 METs
VO2max |
|
Very Light |
<3.2 |
<27 |
<2.8 |
<28 |
<2.4 |
<30 |
<1.8 |
<36 |
|
Light |
3.2-5.3 |
27-44 |
2.8-4.5 |
28-45 |
2.4-3.7 |
30-47 |
1.8-2.5 |
36-51 |
|
Moderate |
5.4-7.5 |
45-62 |
4.6-6.3 |
46-63 |
3.8-5.1 |
48-64 |
2.6-3.3 |
52-67 |
|
Hard |
7.6-10.2 |
63-85 |
6.4-8.6 |
64-86 |
5.2-6.9 |
65-86 |
3.4-4.3 |
68-87 |
|
Very Hard |
≥10.3 |
≥86 |
≥8.7 |
≥87 |
≥7.0 |
≥87 |
≥4.4 |
≥88 |
|
Maximal |
12 |
100 |
10 |
100 |
8 |
100 |
5 |
100 |
Resistance-Type Exercise
|
Intensity |
Relative Intensity
Percent 1RM§ |
|
Very Light |
<30 |
|
Light |
30-49 |
|
Moderate |
50-69 |
|
Hard |
70-84 |
|
Very Hard |
≥85 |
|
Maximal |
100 |
*%VO2R – percent of oxygen uptake reserve; %HRR –
percent of heart rate reserve
¥%HRmax = 0.7305
(%VO2max) + 29.95 (4); values based on 10-MET
group
†Borg Rating of Perceived Exertion 6-20 scale (5)
**%VO2max = [(100%-%VO2R)
METmax-1] + %VO2R; personal communication (6)
§RM = repetitions maximum, the greatest
weight that can be moved once in good form
From: Howley, E. Med Sci Sports Ex. S364-S369, 2001. (7)
Some previous physical activity and health recommendations (8), defined absolute moderate intensity as 3.0 to 6.0 METs and
vigorous intensity as more than 6.0 METs. After carefully reviewing these
classifications, the PAGAC recommends that moderate intensity be defined at 3.0
to 5.9 METs and vigorous intensity as 6.0 or greater METs. This redefinition
means that a number of activities classified as 6.0 METs would now be
considered vigorous intensity rather than moderate intensity. A list of
activities classified as 6.0 METs in the Compendium of Physical Activity (9) is included in Table D.2.
Table D.2. Physical Activities Listed
as 6.0 METs in the Compendium of Physical Activities
|
Compendium Code (2000) |
METs |
Heading (Activity Group) |
Activity Description |
|
2050 |
6 |
Conditioning exercise |
Weight lifting (free weight, nautilus or universal-type), power
lifting or body building, vigorous effort (Taylor Code 210) |
|
2090 |
6 |
Conditioning exercise |
Slimnastics, jazzercise |
|
2110 |
6 |
Conditioning exercise |
Teaching aerobic exercise class |
|
4050 |
6 |
Fishing and hunting |
Fishing in stream, in waders (Taylor Code 670) |
|
4080 |
6 |
Fishing and hunting |
Hunting, deer, elk, large game (Taylor Code 170) |
|
4110 |
6 |
Fishing and hunting |
Hunting, pheasants or grouse (Taylor Code 680) |
|
5120 |
6 |
Home activities |
Moving furniture, household items, carrying boxes |
|
6050 |
6 |
Home repair |
Carpentry, outside house, installing rain gutters, building a
fence, (Taylor Code 640) |
|
6180 |
6 |
Home repair |
Roofing |
|
8020 |
6 |
Lawn and garden |
Chopping wood, splitting logs |
|
8060 |
6 |
Lawn and garden |
Gardening with heavy power tools, tilling a garden, chain saw
|
|
8110 |
6 |
Lawn and garden |
Mowing lawn, walk, hand mower (Taylor Code 570) |
|
8200 |
6 |
Lawn and garden |
Shoveling snow, by hand (Taylor Code 610) |
|
11030 |
6 |
Occupation |
Building road (including hauling debris, driving heavy
machinery) |
|
11100 |
6 |
Occupation |
Coal mining, general |
|
11192 |
6 |
Occupation |
Farming, taking care of animals (grooming, brushing, shearing
sheep, assisting with birthing, medical care, branding) |
|
11320 |
6 |
Occupation |
Forestry, planting by hand |
|
11380 |
6 |
Occupation |
Horse grooming |
|
11560 |
6 |
Occupation |
Shoveling, light (less than 10 pounds/minute) |
|
11780 |
6 |
Occupation |
Using heavy power tools such as pneumatic tools (jackhammers,
drills, etc.) |
|
12010 |
6 |
Running |
Jog/walk combination (jogging component of less than 10 minutes)
(Taylor Code 180) |
|
15050 |
6 |
Sports |
Basketball, non-game, general (Taylor Code 480) |
|
15110 |
6 |
Sports |
Boxing, punching bag |
|
15190 |
6 |
Sports |
Drag racing, pushing or driving a car |
|
15200 |
6 |
Sports |
Fencing |
|
15500 |
6 |
Sports |
Paddleball, casual, general (Taylor Code 460) |
|
15640 |
6 |
Sports |
Softball, pitching |
|
15680 |
6 |
Sports |
Tennis, doubles (Taylor Code 430) |
|
15730 |
6 |
Sports |
Wrestling (one match = 5 minutes) |
|
15733 |
6 |
Sports |
Track and field (high jump, long jump, triple jump, javelin, pole
vault) |
|
16040 |
6 |
Transportation |
Pushing plane in and out of hangar |
|
17027 |
6 |
Walking |
Carrying 16 to 24 lb load, upstairs |
|
17080 |
6 |
Walking |
Hiking, cross country (Taylor Code 040) |
|
17210 |
6 |
Walking |
Walking, 3.5 mph, uphill |
|
18150 |
6 |
Water activities |
Skiing, water (Taylor Code 220) |
|
18300 |
6 |
Water activities |
Swimming, lake, ocean, river (Taylor Codes 280, 295) |
|
18310 |
6 |
Water activities |
Swimming, leisurely, not lap swimming, general |
|
19010 |
6 |
Winter activities |
Moving ice house (set up/drill holes, etc.) |
|
19160 |
6 |
Winter activities |
Skiing, downhill, moderate effort, general |
NOTE: This table is adapted from The Compendium of Physical
Activities (9).
In contrast, relative intensity takes into account or adjusts
for a person's exercise capacity. For aerobic exercise, relative
intensity is expressed as a percent of a person's aerobic capacity
(VO2max) or VO2 reserve, as a percent of a person's
measured or estimated maximum heart rate or heart rate reserve, or as an index
of how hard the person feels he or she is exercising (rating of perceived
exertion) (10). A percent of maximum heart rate or heart
rate reserve can be used because a near linear relation exists between the
increase in heart rate and the increase in oxygen uptake during dynamic aerobic
exercise. Table D.1 also provides the
classification of physical activity intensity showing the relation between
absolute and relative intensity for aerobic activity and relative intensity for
resistance exercise.
In most experimental studies evaluating the effects of increased
activity on various fitness and health outcomes, intensity is expressed
relative to each person's capacity (e.g., 60% to 75% of VO2max).
However, in nearly all of the large prospective observational studies, physical
activity intensity is expressed in absolute terms (no adjustment made for each
person's exercise capacity). These differences in methodology limit to some
degree direct comparison of dose-response data from these 2 major sources of
evidence. For an activity of a given absolute intensity, such as walking at 3.0
miles per hour (3.3 METs), the relative intensity varies inversely to the
aerobic capacity of the individual. As shown in Figure
D.1, for highly fit people with an aerobic capacity of 14 METs, walking at
3.0 miles per hour has a relative intensity of 24 % (left y-axis) or light
intensity (right y-axis), but for people of low fitness who have only a 4-MET
capacity, the relative intensity is at 83% (left y-axis) or hard intensity
(right y-axis). A similar situation is displayed for a walking speed of 4.0
miles per hour with a MET value of 5.0. Note that it is impossible for people
with a 4-MET capacity to walk this fast for an extended period of time, as the
energy requirement exceeds their aerobic capacity. Standardization of activity
intensity classification is essential for accurately establishing the relation
between intensity and health or fitness outcomes.
Figure D.1. The Relative Exercise
Intensity for Walking at 3.0 mph (3.3 METs) and 4.0 mph (5.0 METs) Expressed as
a Percent of VO2max for Adults With an Exercise Capacity Ranging
from 4 to 14 METs
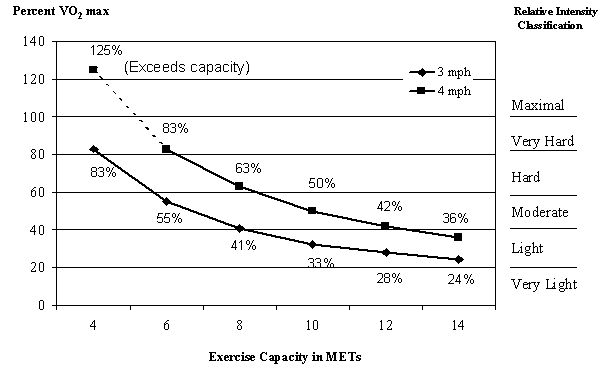
Figure D.1. Data Points
|
Exercise Capacity |
METs
4 |
METs
6 |
METs
8 |
METs
10 |
METs
12 |
METs
14 |
|
3 mph |
83 |
55 |
41 |
32 |
28 |
24 |
|
4 mph |
– |
83 |
63 |
50 |
42 |
36 |
Physical Activity Amount
The amount of physical activity performed by a person for a given period
of time is the product of activity duration, absolute intensity, and frequency.
Thus, the amount of activity is one expression of activity dose. For many of
the prospective observational studies cited in this review, the primary
activity exposure is the amount of leisure-time or total physical activity
expressed in minutes or hours per day or week (of moderate, vigorous, or
moderate plus vigorous activity), distance walked or jogged/run per day or
week. Exposure also can be the estimated amount of energy expended expressed in
kilocalories per day or week, kilocalories per kilogram of body weight per day
or week, or MET-minutes or MET-hours per day or week.
In experimental studies, the amount of activity sometimes has been
expressed in these same units but also has been given with the intensity in
relative units along with the frequency and duration of the activity sessions
with no overall amount or volume of activity provided (e.g., 30 minutes at 70%
heart rate reserve [HRR], 5 times per week for 24 weeks). To pool or compare
results across studies and develop generalized conclusions about the benefits
provided with various amounts of physical activity, it was necessary to be able
to compare one expression of the amount of activity with others.
Table D.3 provides this type of information for
walking, jogging, and running over a range in activity intensity from 3.0 to
16.0 METs.
Table D.3. Walk, Jog, and Run Speeds
and METs, MET-Minutes, MET-Hours, and Distance (miles) for 2.5 Hours (150 min)
and 5.0 Hours (300 min) per Week of Physical Activity. Also Listed Are the
Estimated Kilocalories (kcal) Expended by a 75 kg (165 lb) Adult
During 150 and 300 Minutes per Week at the Different Intensities of
Activity.
|
Speed
(mph) |
METs |
For 2.5 hr/wk (150 min/wk)
MET-min |
For 2.5 hr/wk (150 min/wk)
MET-hours |
For 2.5 hr/wk (150 min/wk)
Miles |
For 2.5 hr/wk (150 min/wk)
kcal |
For 5.0 hr/wk (150 min/wk)
MET-min |
For 5.0 hr/wk (150 min/wk)
MET-hours |
For 5.0 hr/wk (150 min/wk)
Miles |
For 5.0 hr/wk (150 min/wk)
kcal |
|
Rest |
1.0 |
150 |
2.5 |
0.0 |
190 |
300 |
5.0 |
0.0 |
380 |
|
2.5 |
3.0 |
450 |
7.5 |
6.25 |
565 |
900 |
15.0 |
12.5 |
1,130 |
|
3.0 |
3.3 |
495 |
8.25 |
7.5 |
620 |
990 |
16.5 |
15.0 |
1,240 |
|
4.0 |
5.0 |
750 |
12.5 |
10.0 |
940 |
1,500 |
25.0 |
20.0 |
1,880 |
|
4.3 |
6.0 |
900 |
15.0 |
10.75 |
1,125 |
1,800 |
30.0 |
21.5 |
2,250 |
|
5.0 |
8.0 |
1,200 |
20.0 |
12.5 |
1,500 |
2,400 |
40.0 |
25.0 |
3,000 |
|
6.0 |
10.0 |
1,500 |
25.0 |
15.0 |
1,875 |
3,000 |
50.0 |
30.0 |
3,750 |
|
7.0 |
11.5 |
1,725 |
28.25 |
17.5 |
2,155 |
3,450 |
56.5 |
35.0 |
4,310 |
|
8.0 |
13.5 |
2,025 |
33.75 |
20.0 |
2,530 |
4,050 |
67.5 |
40.0 |
5,060 |
|
10.0 |
16.0 |
2,400 |
40.0 |
25.0 |
3,000 |
4,800 |
80.0 |
50.0 |
6,000 |
2.5 - 4.3 mph = walk
5-10 mph = jog/run
† kilocalories for
75 kg adult when exercising at the given intensity for either 150 or 300
minutes.
Note: These are gross energy expenditure values during exercise; thus,
they include the energy expenditure at rest and not just the additional energy
expenditure due to the activity. Kilocalories calculated using 1 MET = 1
kilocalorie per kilogram per hour and rounded to nearest 5 kilocalories. MET
values from Ainsworth and colleagues (9).
Based on data in this table, for 2.5 hours per week of activity at
moderate absolute intensity (3.0 to less than 6.0 METs), a person would have a
range for MET-minutes per week of 450 to less than 900, MET-hours per week of
7.5 to less than 15.0 and, if they weighed 165 pounds (75 kilograms), their
kilocalories of energy expenditure would range from 565 to less than 1,125
kilocalories. If this were achieved by walking at various speeds, the distance
would range from 6.25 to less than 10.75 miles per week. At 5 hours per week of
moderate-intensity activity, the MET-minutes per week would range from 900 to
less than 1,800 and MET-hours per week would range from 15.0 to less than 30.0.
Kilocalories expended by a 165-pound (75 kilogram) adult would range from 1,130
to less than 2,250 and the distance walked would be 12.5 to less than 21.5
miles.
The energy expenditure values in Table D.3
are estimated gross values. They include both the energy expenditure required
at rest (1 MET) as well as the added (net) energy expenditure required for
performing the activity. The estimated energy expenditure for a 165-pound (75
kilogram) person at rest for 150 minutes during the week is about 190
kilocalories. If that person instead walked at a 3.0 mile per hour pace for the
150 minutes, his or her estimated energy expenditure during this time would be
about 620 kilocalories, or an increase above rest of 430 kilocalories. However,
if the person jogged at a 6 mile per hour pace for these 150 minutes, he or she
would expend approximately 1,875 kilocalories, or an increase above rest of
about 1,685 kilocalories. Thus, a 165-pound person jogging at 6 miles per hour
for 150 minutes per week would expend approximately 1,255 more kilocalories
than if he or she walked at 3 miles per hour for the same amount of time during
the week. This example demonstrates the substantial increase in energy
expenditure as the intensity of the activity increases. In this example, the
increase in kilocalories while jogging is nearly 4 times greater than
the increase while walking (430 versus 1,655).
Recent Trends in Physical Activity in the
United States
Since the 1995 physical activity and public health recommendations
published by the Centers for Disease Control and Prevention and the American
College of Sports Medicine (8) and Physical Activity
and Health: A Report of the Surgeon General published in 1996 (11), national health behavior surveillance systems have
collected cross-sectional information on self-reported compliance with these
recommendations by representative samples of Americans. The major national
public health surveillance systems monitoring physical activity in the US
population include the Behavioral Risk Factor Surveillance System (BRFSS;
http://www.cdc.gov/brfss/), the Youth
Risk Behavior Surveillance System (YRBSS;
http://www.cdc.gov/HealthyYouth/yrbs/),
National Health and Nutrition Examination Survey (NHANES;
http://www.cdc.gov/nchs/nhanes.htm),
and the National Health Interview Survey (NHIS;
http://www.cdc.gov/nchs/nhis.htm).
For details regarding the methodologies used by each of these surveys, readers
are referred to their respective websites. These surveys provide snapshots of
participation in selected types or categories of activities by adults and youth
and participation in structured programs of activity, such as physical
education and organized sports in youth. They include measures of inactivity as
well as of activity and, in many cases, include information through 2005. No
surveillance system exists that captures an overall determination of physical
activity performed or the energy expended during activity throughout the day
– during work, school, home and self care, commuting, and leisure time.
However, one systematic review of physical activity trends over the past 50
years suggest that declines have occurred in work-related activity,
self-transportation activity, and activity in the home, resulting in overall
decrease in physical activity (12).
Adults and Older Adults
The BRFSS is a state-based random-digit dialed telephone survey of the
non-institutionalized US civilian population aged 18 years and older. Beginning
in 2001, BRFSS included biannual questions about leisure-time physical activity
asking whether respondents participated in either moderate- or
vigorous-intensity activity in bouts of at least 10-minute duration. If they
did, respondents were asked to report the frequency and duration of these
activities (13). Participants who reported at least 30
minutes of moderate-intensity activity 5 or more days per week or 20 minutes of
vigorous-intensity activity 3 or more days per week, or both were considered to
be engaged in regular physical activity and to meet current recommendations. In
2005, the prevalence of women reporting that they regularly engaged in physical
activity was 46.7%, which was a relative increase of 8.6% from 2001 (43.0%),
while men increased 3.5%, from 48.0% to 49.7%. For women, a significant
increase between 2001and 2005 was reported in all racial/ethnic groups and all
age and education level categories except for women aged 18 to 24 years (Figure D.2). Among men, significant increases were
observed for the age range 45 to 64 years, non-Hispanic whites, non-Hispanic
blacks, high school graduates and college graduates.
As can be seen in Figure D.2, the
percentage of men who reported being physically active is greater than for
women and steadily declines with age in both sexes. The prevalence at age 18 to
24 years is 60.5% for men and 50.8% for women, but significantly decreases by
age 65 years and older to 43.1% in men and 32.2% in women. For both men and
women, higher levels of education were associated with a higher prevalence of
reporting being physically active, ranging from 35.5% and 34.2% for men and
women who had not graduated from high school up to 52.6% and 49.1% for men and
women who were college graduates. Non‑Hispanic white men and women tend
to have a higher reported prevalence of being active than other racial/ethnic
groups with the largest differences in 2005 being between non-Hispanic white
and black women and between non-Hispanic white men and Hispanic men.
The data presented in Figure D.2 are quite
consistent with self-report data from other national surveys conducted over the
past decade.
Figure D.2. Estimated Age Adjusted
Percentage of Persons ≥18 Years Reported Meeting the Healthy People 2010
Objective for Regular Physical Activity in 2001 and 2005: Data from BRFSS
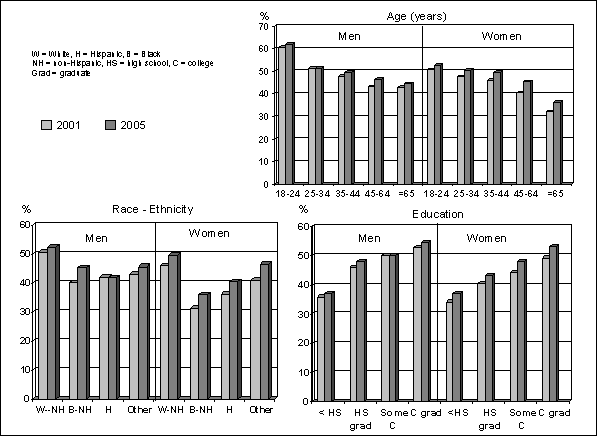
Figure D.2. Data Points Age
|
Year |
Men
18-24 |
Men
25-34 |
Men
35-44 |
Men
45-64 |
Men
*65 |
Women
18-24 |
Women
25-34 |
Women
35-44 |
Women
45-64 |
Women
*65 |
|
2001 |
60.5 |
51.4 |
47.8 |
43.3 |
43.1 |
50.6 |
47.7 |
46.2 |
40.6 |
32.2 |
|
2005 |
62 |
51.5 |
49.6 |
46.5 |
44.5 |
52.7 |
50.5 |
49.7 |
45.5 |
36.3 |
Figure D.2. Data Points Race — Ethnicity
|
Year |
Men
W--NH |
Men
B-NH |
Men
H |
Men
Other |
Women
W-NH |
Women
B-NH |
Women
H |
Women
Other |
|
2001 |
50.6 |
40.3 |
42 |
43.1 |
46 |
31.4 |
36.3 |
41.2 |
|
2005 |
52.3 |
45.3 |
41.9 |
45.7 |
49.6 |
36.1 |
40.5 |
46.6 |
Figure D.2. Data Points Education
|
Year |
Men
< HS |
Men
HS grad |
Men
Some C |
Men
C grad |
Men
<HS |
Men
HS grad |
Men
Some C |
Men
C grad |
|
2001 |
35.8 |
46 |
50.3 |
52.6 |
34.2 |
40.3 |
44.3 |
49.1 |
|
2005 |
37.2 |
47.9 |
50.3 |
54.6 |
37.1 |
43.2 |
47.9 |
53.3 |
Figure D.3 displays data from the Healthy
People 2010 Database (DATA2010) for men and women combined for selected
measures of physical activity reported annually from 1997 to 2006 (14). Over this period, 30% to 35% of adults reported
participation in moderate- or vigorous-intensity activity sufficient to meet
existing recommendations, and those reporting no leisure time activity remained
in the 35% to 40% range. Neither of these measures showed a consistent trend
over time. From 1997 through 2000, approximately 16% of the adult population
reported performing muscle strength and endurance exercises, with an increase
to about 20% being reported from 2001 to 2006.
Figure D.3. Reported Physical Activity
by Adults in the USA: 1997-2006 The Healthy People 2010 Database
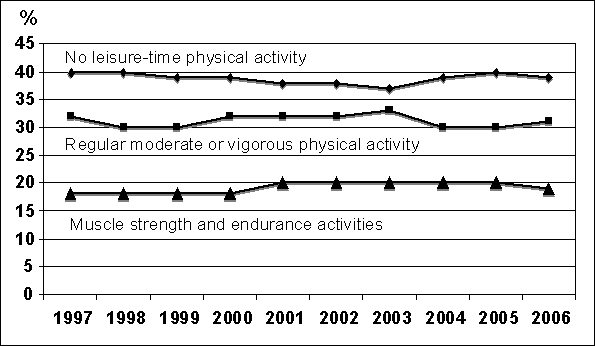
Figure D.3. Data Points
|
Activity |
1997 |
1998 |
1999 |
2000 |
2001 |
2002 |
2003 |
2004 |
2005 |
2006 |
|
No leisure-time physical activity |
40 |
40 |
39 |
39 |
38 |
38 |
37 |
39 |
40 |
39 |
|
Regular moderate or vigorous physical activity |
32 |
30 |
30 |
32 |
32 |
32 |
33 |
30 |
30 |
31 |
|
Strength and endurance activities |
18 |
18 |
18 |
18 |
20 |
20 |
20 |
20 |
20 |
19 |
Depending on how the questions are asked and the activity classification
criteria used, responses to the various national physical activity surveillance
systems indicate that 45% to 50% of adults in the US report meeting current
public health recommendations for moderate-to-vigorous physical activity
(defined as moderate-intensity activities [i.e., brisk walking, bicycling,
vacuuming, gardening, or anything else that causes small increases in breathing
or heart rate] for at least 30 minutes per day at least 5 days per week, or
vigorous-intensity activities [i.e., running, aerobics, heavy yard work, or
anything else that causes large increases in breathing or heart rate] for at
least 20 minutes per day at least 3 days per week, or both). About 38% to 40%
report being insufficiently active (defined as doing more than 10 minutes total
per week of moderate- or vigorous-intensity lifestyle activities [i.e.,
household, transportation, or leisure-time activity] but less than the
recommended level of activity). Around 25% report performing no
moderate-to-vigorous physical activity during leisure time (defined as no
physical activities or exercises such as running, calisthenics, golf,
gardening, or walking in the previous month), and approximately 15% are
considered inactive (defined as less than 10 minutes total per week of
moderate- or vigorous-intensity lifestyle activities [i.e., household,
transportation, or leisure-time activity]. Figure
D.4 provides data from the BRFSS for 2001-2005 for all adults combined (13).
Figure D.4. Reported Physical Activity by
Adults in the USA: 2001-2005 Data from BRFSS
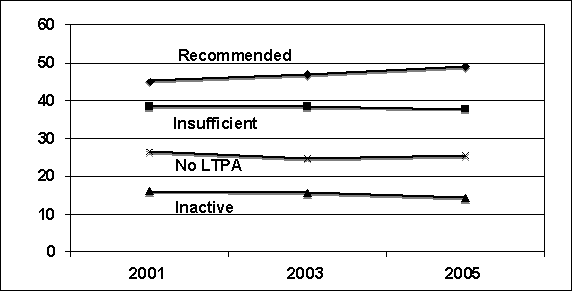
"Recommended," "Insufficient," and "Inactive" data comprise one measure,
and responses should sum to ~100%. "No Leisure-Time Physical Activity" is a
separate question, and should not be included with calculations for the
recommended, insufficient, or inactive.
Figure D.4. Data Points
|
Physical Activity |
2001 |
2003 |
2005 |
|
Recommended |
45.3 |
46.9 |
48.8 |
|
Insufficient |
38.6 |
38.5 |
37.7 |
|
No leisure-time physical activity |
26.3 |
24.6 |
25.4 |
|
Inactive |
16.0 |
15.6 |
14.2 |
Youth
Based on data from the YRBSS for 2005, 35.8% of high school students
reported meeting current physical activity recommendations (defined as
performing any kind of physical activity that increased their heart rate and
made them breathe hard some of the time (i.e., moderate or vigorous intensity)
for at least 60 minutes per day on 5 or more days of the 7 days preceding the
survey) (5). The reported prevalence of meeting this level
of physical activity was higher in boys (43.8%) than girls (27.8%) and higher
in white (46.9%), black (38.2%), and Hispanic (39.0%) boys than for white
(30.2%), black (21.3%), and Hispanic (26.5%) girls. Prevalence estimates of
meeting current recommendations of at least 60 minutes per day 5 or more days
per week of moderate- or higher-intensity activity ranged from 26.9 to 45.9%
across state surveys (median 33.9) for students in grades 9-12.
The recommended level of physical activity used as a benchmark by the
YRBSS before the 2005 survey was either 20 minutes of vigorous-intensity
activity (activities that make a person sweat and breathe hard) at least 3 days
per week or at least 30 minutes of moderate-intensity activity (activity that
does not cause a person to sweat or breathe hard) on at least 5 days per week.
The percentage of students meeting these recommendations in 2005 was
substantially higher than for the updated 60 minutes per day recommendations:
boys (75.8%) were higher than girls (61.5 %) and white (77.0%), black (71.7%),
and Hispanic (76.0) boys had higher compliance rates than did white (63.3%),
black (53.1%), and Hispanic (62.6%) girls. Students reporting not participating
in any moderate or vigorous intensity activity during the past 7 days was 7.6%
nationwide, with a higher prevalence among girls (11.3%) than among boys (7.9%)
and higher among black (14.4%) than white (8.1%) and Hispanic students
(10.6%).
In 2005, 54.2% of high school students reported attending a physical
education (PE) class one or more days per week on an average week they were in
school with a higher percentage of boys (60.0%) reporting yes than girls
(48.3%) and higher percentages of white (58.1%), black (61.7%), and Hispanic
(65.9%) boys reporting yes than white (46.1%), black (50.5%), and Hispanic
(57.5%) girls. The prevalence of attending PE class at least one day per week
varied by state from a low of 25.2% to a high of 94.2%. However, when the
frequency criteria for attending PE class was increased from 1 day per week to
5 days in an average week, the prevalence decreased to 37.1% for boys and 29.0%
for girls, with the variation among states ranging from 6.7% to 60.7%.
Based on data from the various physical activity questions contained in
the YRBSS for 2005, high school boys tend to meet moderate-to-vigorous physical
activity recommendations more frequently than do girls, with this sex
difference being true for white, black, and Hispanic youth. Overall, it appears
that white high school students report being somewhat more active than Hispanic
and black students, but their attendance in PE classes does not appear to be
any different.
Figure D.5 displays the trends for various
indices of physical activity for high school students for the period 1999-2005
collected using the YRBSS (14). Included are the
percentage of students who met the previous recommendations of either moderate-
or vigorous-intensity activity, students reporting no moderate or vigorous
physical activity, and the percentage of students reporting attending PE class
5 days per week on average or at least one day per week. The overall impression
gained from the data displayed in this figure is that over this 7-year period,
neither reported activity meeting moderate-to-vigorous physical activity
recommendations or attendance in high school PE classes changed much. The
prevalence of students not reporting any moderate-to-vigorous physical activity
over the past week also has remained quite constant.
Figure D.5. Percent of High School
Students in the United States with Various Physical Activity Profiles:
1999-2005 Data from YBRFSS
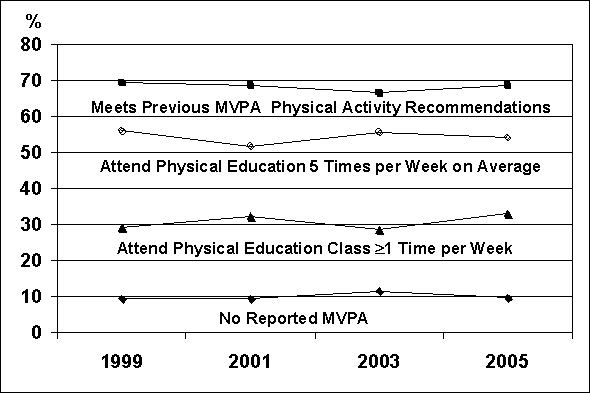
Figure D.5. Data Points
|
Activity |
1999 |
2001 |
2003 |
2005 |
|
Meet moderate or vigorous physical activity |
69.5 |
68.6 |
66.6 |
68.7 |
|
Physical education class 5 times per week |
56.1 |
51.7 |
55.7 |
54.2 |
|
Physical education class ≥1 time per week |
29.1 |
32.2 |
28.4 |
33 |
|
No moderate or vigorous physical activity |
9.4 |
9.5 |
11.5 |
9.6 |
Comment on Measures of Physical Activity
Trends in the United States
As mentioned previously, no national surveillance system in the United
States attempts to document all activity performed throughout the day. Also, no
national surveillance system exists to track physical activity of young
children not yet in high school or to specifically target the rapidly
increasing older population. The results of the national surveillance systems
cited above generally indicate some small changes in the activity status of
youth and adults in the past 5 to 10 years, primarily based on whether or not
they meet current physical activity recommendations. Data from the BRFSS for
2001-2005 do demonstrate a 6% or so relative increase in adults meeting
moderate-to-vigorous physical activity recommendations, and other BRFSS data
for the period 1994-2004 indicate that the percentage of the population who
reported no LTPA decreased from 29.8% in 1994 to 23.7% in 2004 (13). However data collected using the NHIS indicate that the
percentage of adults who engaged in regular leisure-time physical activity did
not change between 1997 and 2006.
Overall, the data provided by these national surveillance programs
consistently demonstrate that a majority of adults do not meet current physical
activity and public health recommendations. Although about two-thirds of high
school students report meeting previous moderate-to-vigorous physical activity
recommendations (at least 30 minutes of moderate intensity activity at least 5
days per week, or vigorous intensity activity at least 20 minutes at least 3
times per week), only 35.8% report meeting the current recommendations (at
least 60 minutes per day of moderate or vigorous intensity activity on at least
5 days per week) (5). Also, any changes in the various
indices of physical activity for high school students have been small and
inconsistent over the past decade.
The use of self-report instruments to monitor physical activity over
time is known to have a variety of limitations given the diversity of
activities that are performed daily by people with different jobs, home care
responsibilities, commuting patterns, and leisure-time pursuits. Attempting to
obtain adequate detail so that accurate classifications of activity status can
be made based on type, intensity, and amount of activity is difficult and can
lead to inaccurate information and increased non-response. Until recently, no
real option existed for collecting physical activity surveillance data other
than by self-report. However, over the past decade, the technology of objective
physical activity monitors, especially accelerometers, that can be used in
large and diverse populations has developed substantially. Initially, these
monitors were used in small-scale studies, but accelerometer data describing
the physical activity patterns in relatively large (n=1,100 to 6,800) samples
(1-3) has recently been published. These initial reports
demonstrate the substantial potential for the use of such devices in national
physical activity surveillance programs but also present a challenge for
analyzing the large amounts of data they produce and interpreting results. For
example, accelerometers were used to collect NHANES data minute by minute
during waking hours over 7 days in approximately 6,800 children, adolescents,
and adults (1). Based on these data, 42% of children aged 6
to 11 years met the current 60 minutes per day recommendation but only 8% of
adolescents met this goal and fewer than 5% of adults met the 30 minutes or
more per day recommendation. These estimates of physical activity participation
are substantially lower than those obtained in nationally representative
surveys by self-report described above. The reasons for the differences are not
clear. One reason may be participant over-estimation of physical activity in
self-report surveys. Alternatively, accelerometers may not be accurately
capturing all reported physical activity for a variety of reasons. Most likely,
some combination of reasons explain the disparity. A much better understanding
of how objective physical activity measurements obtained with currently
available and new instrumentation relate to a variety of health outcomes is
needed before such measurements can be used to inform future physical activity
recommendations and policy statements.
Development of Physical Activity Guidelines
in the United States[1]
By the late 1960s, a number of individuals and organizations in the
United States had recognized the increasingly sedentary nature of the
population and the negative health and fitness consequences of this decline in
activity, and were promoting their own interpretation of a good or best
exercise program. Data from a growing number of observational and experimental
studies supported the value of being physically active, but no consensus
existed on what programs were most effective and safe. Also, during the early
1960s, death rates from coronary heart disease were still on the rise and few
effective treatments for preventing sudden cardiac death were available. It was
well established that the increased work of the heart during vigorous exercise
could trigger cardiac arrest or myocardial infarction in persons with coronary
atherosclerosis. However, investigators and clinicians lacked an understanding
of the etiology of the atherothrombotic disease process, how to detect it in
at-risk populations, and what types and intensities of exercise were safe. Many
people, including physicians, were very concerned about adults older than age
45 years increasing their physical activity, especially starting a vigorous
exercise program or participating in athletic competition. It was this
combination of concern about the need to promote exercise, but at the same
time, fear that promoting exercise, if not carefully controlled, would cause
many people to experience sudden cardiac death that precipitated the
development of the first physical activity guidelines and recommendations. The
evolution of the guideline process over a 35-year period has been characterized
by attempts to reduce risk while maximizing benefit by providing
clinically-oriented recommendations for patient or "at-risk" populations and by
public health-oriented recommendations for the general public.
Early Development of Physical Activity
Recommendations and Guidelines
By the early 1970s, data from several epidemiologic and experimental
studies demonstrated that physically active persons, including patients with
coronary heart disease (CHD), had better health outcomes than did their less
active counterparts. These data were useful in preparing early guidelines
because the major concern was how to minimize risk while achieving health
benefits. The earliest such guidelines were published by the American Heart
Association (AHA) in 1972 and 1975. The first publication was Exercise
Testing and Training of Apparently Healthy Individuals: A Handbook for
Physicians (16). These guidelines were directed more
at reducing the cardiovascular risk imposed by performing moderate- to
vigorous-intensity exercise, including exercise testing for the "coronary
prone," than at providing information on how to help patients become more
physically active. The authors indicated that available data supported exercise
in the rehabilitation of patients with CHD, but data were still inadequate to
support widespread promotion of exercise for the prevention of CHD. The authors
also advised that the exercise recommendations for the healthy but sedentary
person, particularly for the middle-aged male, "not be arbitrarily formulated"
and that "exercise intensity must be adjusted to individual capacity at the
beginning of the program and regulated periodically during the succeeding
stages."
The AHA's second publication, Exercise Testing and Training of
Individuals with Heart Disease or at High Risk for its Development: A Handbook
for Physicians, also focused more on assessment of exercise capacity and
issues of risk than on details of program implementation, and more on
rehabilitation than on secondary prevention (17). The
following quote from the publication is an indication of the clinical approach
taken to exercise guidelines in the 1970s: "Exercise is a therapeutic agent
designed to promote a beneficial clinical effect and, as such, has specific
indications and contraindications and possible toxic or adverse reactions"
(page 24).
During this same time period, several professional organizations and
government agencies began to issue recommendations, guidelines, and position
stands on the importance of being physically active, how much of what types of
activity should be performed, and how best to implement a safe activity plan to
increase health and fitness. In 1973, Exercise and Sport Sciences Reviews
published "The Quantification of Exercise Training Programs," a review of
research on endurance exercise training and cardiorespiratory fitness by
Michael Pollock (18). Much of the information developed
during this review was used by Pollock and colleagues as the scientific basis
for the first American College of Sports Medicine (ACSM) Position Statement on
"The Recommended Quantity and Quality of Exercise for Developing and
Maintaining Fitness in Healthy Adults," which was published in 1978 (19). This Position Statement focused on "developing and
maintaining cardiorespiratory fitness and body composition in healthy adults,"
and its key recommendations were that individuals perform an endurance-type
activity for 15 to 60 minutes, 3 to 5 days per week, at 60% to 90% of heart
rate reserve or 50% to 85% of maximal oxygen uptake. Although reasonably brief
(2.5 pages of text and 90 references), the recommendations in this document
became the mainstay for most exercise professionals and much of the public
wanting to know, "How much exercise is enough?" It is worthwhile noting that
all the references cited in this document were from the field of exercise
physiology, with none from physical activity or behavioral epidemiology.
The ACSM reissued this Position Stand in 1990 and changed the title to
"The Recommended Quantity and Quality of Exercise for Developing and
Maintaining Cardiorespiratory and Muscular Fitness in Healthy Adults" (20). The dose of exercise recommended was quite similar to
the 1978 recommendation, with frequency and exercise mode remaining the same,
session duration changing from "15 to 60" minutes to "20 to 60" minutes, and
intensity changing from "60% to 90% of heart rate reserve or 50% to 85% of
maximal oxygen uptake" to "60% to 90% of maximum heart rate or 50% to 85% of
maximal oxygen uptake or heart rate reserve." A specific recommendation for
enhancing muscle strength was added: one set of 8 to 12 repetitions of 8
exercises, 2 days per week. The statement also indicated that less intensive
exercise might also provide health benefits: "ACSM recognizes the potential
health benefits of regular exercise performed more frequently and for a longer
duration, but at lower intensities than presented in this position statement."
(p. 266).
In 1998, the ACSM published the third edition of its Position Stand,
entitled, "Quantity and Quality of Exercise for Developing and Maintaining
Cardiorespiratory and Muscular Fitness, and Flexibility in Healthy Adults" (21). The primary recommendations for exercise to enhance
cardiorespiratory and body composition remained similar to the 1978 and 1990
recommendations except for a small reduction at the low end of the intensity
range: 55% to 90% of maximum heart rate instead of 60% to 90% or 40% to 85% of
maximal oxygen uptake reserve or heart rate reserve instead of 50% to 85%. This
1998 document also included recommendations for flexibility and adopted the
concept of accumulation from public health recommendations published by the
Centers for Disease Control and Prevention (CDC) and ACSM in 1995 (8). (See the following section for more details on the 1995
CDC/ACSM recommendations.) In discussing "duration of training, the ACSM
Position Stand recommended "20 to 60 minutes of continuous or intermittent
(minimum of 10‑minute bouts accumulated throughout the day) of aerobic
activity."
In addition to these Position Stands, the ACSM as well as other
organizations developed publications that provided detailed guidelines for
specialists such as physicians, exercise scientists, physical educators,
physical therapists, coaches, and nurses. These guidelines were intended for
use in providing exercise and fitness evaluations, developing physical activity
prescriptions or plans for individuals or groups, and providing exercise
instruction or leadership for patients and healthy persons. Included in these
documents were the 7 editions of Guidelines for Exercise Testing and
Exercise Prescription published by the ACSM between 1975 and 2005 (10;22-27) and Exercise Standards: A Statement for Healthcare
Professionals from the American Heart Association (28).
A Paradigm Shift to Public Health Physical
Activity Guidelines
Starting in the mid-1980s, various medical and public health
organizations held discussions and published manuscripts on public health
rather than clinical approaches to physical activity for achieving improved
health outcomes (29). For example, CDC's Behavioral
Epidemiology and Evaluation Branch organized a "Workshop on the Epidemiological
and Public Health Aspects of Physical Activity and Exercise" in 1984, in which
experts reviewed the current knowledge base relating physical activity to
health status and identified actions to be taken to increase the activity
status of Americans (30). Ten manuscripts were prepared as
the basis for discussion during the conference, and they were published along
with a conference overview (31). This meeting played a
significant role in setting the stage for the evolution of a public health
paradigm for physical activity over the next decade.
The goal of this effort was to augment or supplement, but not
necessarily replace, the existing exercise-for–fitness paradigm promoted
by the ACSM and other organizations by focusing primarily on enhancing physical
fitness or working capacity, either in healthy persons or in the rehabilitation
of various patient populations (32). During this 10-year
period, substantial new data were published, especially from physical activity
epidemiology, which related inactivity to increased risk of several chronic
diseases and the potential protective effects of moderate-intensity, as well as
vigorous-intensity activity. In addition, researchers reconsidered some of the
prior epidemiologic data with respect to the most likely kinds and patterns of
physical activity that were carried out by active people, who comprised some of
the lower-risk groups. The tentative conclusion was that much of this
risk-reducing activity was of moderate intensity (usually considered 3.0 to 6.0
METs) and that it was frequently performed in repeated short bouts. Thus, a
disconnect appeared to exist between the accepted exercise-fitness paradigm,
which emphasized vigorous activity performed in bouts of at least 20 minutes
duration, and the intensity and bout duration that appeared to provide some
protection against selected chronic diseases and all-cause mortality.
For example, the results of some studies indicated that regular walking
or other moderate-intensity activity, or moderate levels of cardiorespiratory
fitness, were associated with reduced rates of cardiovascular disease (CVD) and
all-cause mortality (4;33;34). Also, an increasing number of experimental studies
showed disease risk factors or health-related fitness measures to be
significantly improved in sedentary adults as a result of adherence to a
program of regular walking or other moderate-intensity activity (35-37). During this time, a team of Canadian exercise
scientists organized two major international conferences on Exercise, Fitness
and Health (38) and Physical Activity, Fitness and Health
(39). For both conferences, the goal was to understand the
relationship of physical activity and fitness to major health outcomes, develop
a conceptual model for these relationships, and formulate a consensus
statement. These conferences and publications provided an excellent resource
for the developing consensus that a physically inactive lifestyle is a major
contributor to poor health outcomes throughout the lifespan.
In 1992, in light of the mounting evidence that a sedentary lifestyle
significantly increased the risk of CHD morbidity and mortality, the AHA made
sedentary lifestyle its fourth major CHD risk factor, joining cigarette
smoking, hypertension, and hypercholesterolemia (40). This
statement was the first formal recognition by the AHA that physical inactivity
was a major independent risk factor for atherosclerotic heart disease and that
physical activity could play a role in both primary and secondary prevention of
CHD. This document went beyond recognizing just the benefits of exercise for
heart disease to stating that people of all ages could benefit from a regular
exercise program. It noted that activities such as walking, hiking, swimming,
cycling, tennis, and basketball were especially beneficial if performed at 50%
or more of a person's work capacity and that even low-intensity activities
performed daily could have some long-term health benefits. This statement has
been updated over the years by the AHA but without major changes in the key
statements made in 1992; the most recent update was published in 2003 (41).
Given the influential nature of official position statements or
recommendations by the AHA on heart disease prevention and treatment practices
by the medical community in the United States, the elevation of inactivity to a
major CHD risk factor brought substantial attention to the importance of a
physically active lifestyle. Although this statement indicated the general
nature of the activity that should be performed to help maintain good health,
it lacked specific details regarding program design and implementation.
However, it did indicate that intensities lower than that generally promoted in
the past could provide health benefits.
In 1993, the year following the AHA statement recognizing inactivity as
a major CHD risk factor, the CDC in collaboration with the ACSM, began
developing a document that would provide specific recommendations about the
profile of physical activity that should be performed to promote good health.
To develop this statement, an expert panel was appointed that consisted of
epidemiologists, exercise physiologists, public health professionals, and
health psychologists. The panel was charged with developing a statement
grounded in solid science that would clearly communicate its key messages to
the public and provide a program that could be performed by a large segment of
the general public with a minimal increase in risk. It took 2 years of work by
the panel before Physical Activity and Public Health: A Recommendation from
the Centers for Disease Control and Prevention and the American College of
Sports Medicine was released to the public in 1995 (8). These first public health guidelines on physical activity
and health were the culmination of a decade of work that began in 1984 with the
CDC Workshop on the Epidemiological and Public Health Aspects of Physical
Activity and Exercise.
The approach to physical activity for health taken by these "public
health" guidelines was quite different than prior guidelines primarily based on
the "exercise training" or "clinical" paradigm. The primary recommendation was
that "Every American adult should accumulate 30 minutes or more of
moderate-intensity physical activity on most, preferably all, days of the
week." Because many of the prior recommendations had primarily advocated
vigorous-intensity activity, having moderate-intensity activity as the key
recommendation (even though prior guidelines based on vigorous-intensity
exercise were recognized as still effective) raised many questions by exercise
scientists and practitioners. The idea that substantial health benefits could
be derived from brisk walking was not appreciated by many fitness advocates,
but this recommendation was based on data from a variety of epidemiologic and
experimental studies. Even more controversial was the idea that the activity
each day did not need to be performed continuously for at least 30 minutes, but
could be accumulated throughout the day in bouts of 8 to 10 minutes.
For many years, the idea that the activity needed to be continuous to be
effective had been promoted in programs such as "Aerobics" (42) but without any scientific evaluation. In retrospect, the
recommendation for accumulated bouts appears to have been correct. However, in
1995, the published scientific data supporting this concept was quite limited,
and remains so today. Only several experimental studies had directly compared
the effects of continuous exercise bouts versus exercise accumulated through
bouts of 8 to 10 minutes duration (43-45), and the nature
of data collection in epidemiologic studies made the evaluation of the
accumulation concept difficult, at best, to evaluate.
Following close on the heels of the CDC/ACSM report, the National
Institutes of Health (NIH) convened a consensus conference on "Physical
Activity and Cardiovascular Health" (46). The charge to
this nonfederal, non-advocate 13-member panel representing cardiology,
psychology, exercise physiology, nutrition, pediatrics, public health and
epidemiology was "to provide physicians and the general public with a
responsible assessment of the relationship between physical activity and
cardiovascular health." During the 3-day conference, the panel listened to
reports from 27 scientists on the relationship between physical activity and
cardiovascular health, had open discussions with the presenting scientists and
others in attendance, and held closed deliberations to formulate their
recommendations. The draft recommendations were shared with conference
participants and conflicting views were resolved and a final document
produced.
The panel concluded that: (1) most Americans have little or no physical
activity in their daily lives; (2) accumulating evidence indicates that
physical inactivity is a major risk factor for cardiovascular disease; (3)
moderate levels of physical activity confer significant health benefits; (4)
all Americans should engage in regular physical activity at a level appropriate
to their capacity, needs and interests; and (5) children and adults should set
a goal of accumulating at least 30 minutes of moderate intensity physical
activity on most, and preferably all, days of the week.
The panel also recognized that a greater amount and/or intensity of
activity than the recommended minimum would provide greater health benefits for
most people (i.e., dose response) and that cardiac patients should integrate
increased physical activity into a comprehensive program of risk reduction.
Thus, the panel made recommendations highly consistent with the CDC/ACSM
working group in that it emphasized performing moderate-intensity physical
activity (using brisk walking as a benchmark) on most or all days for at least
30 minutes per day, and noted the activity could be accumulated in bouts of at
least 8 to 10 minutes duration. It also recognized that its recommendation was
a minimum, and greater health benefits were achievable by performing greater
amounts of activity or through "vigorous exercise." In other words, the prior
recommendations of vigorous exercise performed for 20 to 30 minutes 3 days per
week still applied.
At the same time the NIH was producing its consensus panel report, the
World Health Organization also issued a report on the health benefits of
regular activity (47). The major recommendations in this
document were very consistent with recommendations made by the CDC/ACSM working
group and the NIH consensus panel, namely that a target for all adults should
be 30 minutes or more of moderate-intensity physical activity on most days. The
WHO report also stated that daily physical activity should be the cornerstone
for a healthy lifestyle throughout the lifespan; that more vigorous exercise,
such as slow jogging, cycling, field and court games, and swimming, could
provide additional health benefits; and that people with disabilities or
chronic disease had a great deal to benefit from an individualized activity
program. While recognizing that the responsibility for personal health
decisions ultimately lies with the individual and family, policy
recommendations for increasing physical activity were included in the report as
well for major government organizations.
The CDC/ACSM, NIH, and WHO reports on physical activity and health, all
published in 1995 and 1996, set the stage for the publication of Physical
Activity and Health: A Report of the Surgeon General in 1996 (11). This report was commissioned by the Secretary of Health
and Human Services in 1994 and authorized the CDC to be the lead agency for its
development with collaboration from a number of federal organizations,
especially the President's Council on Physical Fitness and Sports and the NIH.
Non-government collaborating organizations included the ACSM, AHA, and the
American Association of Health, Physical Education, Recreation and Dance. This
was an extensive undertaking, and approximately 195 people contributed to
writing, editing, reviewing, and publishing the report.
The stated goal of the Surgeon General's report was to summarize the
existing literature on the role of physical activity in preventing disease and
on the status of interventions to increase physical activity. It provided an
historical background on the relation of physical activity to health, including
the evolution of physical activity guidelines, looked at patterns and trends of
physical activity in different populations in the United States, and described
various projects to promote increased physical activity in youth and adults. It
also summarized information on acute and chronic physiological responses to
exercise and provided a systematic review of the effects of physical activity
on major health outcomes. The report grew out of an emerging consensus among
investigators and providers working in exercise science, epidemiology, public
health, clinical medicine, health psychology, and education that the high
prevalence of sedentary behavior among the American population was having a
significant negative health impact, that a moderate amount and intensity of
physical activity in this sedentary population could provide important health
benefits, and that innovative, long-term programs were needed to reverse the
continuing downward trend in physical activity.
The key recommendation from the Surgeon General's report was that people
of all ages could improve the quality of their lives through a lifelong
practice of moderate-intensity physical activity: "A regular, preferably daily,
regimen of at least 30 to 45 minutes of brisk walking, bicycling, or even
working around the house or yard will reduce the risk of coronary heart
disease, hypertension, colon cancer and diabetes." A second key message was
that "more is better." People already performing a moderate level of activity
would benefit even more by increasing the intensity and/or duration of their
activity. Both the CDC/ACSM report and the report by the Surgeon General have
been cited frequently in the professional literature on physical activity and
health, and the key recommendations, usually with no or only minor
modifications, have been adopted by national agencies in a number of other
countries.
To help assess the information available on the dose of physical
activity needed for specific health outcomes, an international "consensus
symposium" was held at Hockley Valley, Ontario, Canada in 2000 (48). The goal of this evidence-based symposium was to provide
a comprehensive review of the existing science relating physical activity dose
to health and to make specific recommendations regarding physical activity
dose. The major conclusion regarding the dose-response relation for specific
outcomes was that the available data were still inadequate to define any
precise relation. However, the consensus panel did endorse the recommendations
made in the CDC/ACSM report (8) and the Surgeon General's
report (11).
The Institute of Medicine Report
In 2002, the Institute of Medicine (IOM) published a report primarily
focusing on macronutrient intake and energy intake and expenditure. The report
developed estimates of daily intake that are compatible with good nutrition
throughout the life span and that may decrease the risk for chronic disease (49). The preparation of this report by the IOM, a private
nonprofit organization and component of the National Academy of Sciences, was
funded by HHS, the US Department of Agriculture (USDA), the US Department of
Defense, and Health Canada. The panel considered the level of macronutrient,
and thus caloric intake, consistent with good health and the caloric
expenditure needed to keep people in a healthy weight range, defined as a body
mass index (BMI) of 18.5 to 25.0 kg/m2. For people to achieve these
goals, the panel concluded the following regarding physical activity:
"Physical activity promotes health and vigor. Cross-sectional data from
a doubly labeled water database were used to define a recommended level of
physical activity, based on the physical activity level (PAL) associated with a
normal body mass index (BMI) range of 18.5 to 25 kg/m2. In addition
to the activities identified with a sedentary lifestyle, an average of 60
minutes of daily moderate intensity physical activity (e.g., walking/jogging at
3 to 4 miles/hour) or shorter periods of more vigorous exertion (e.g., jogging
for 30 minutes at 5.5 miles/hour) was associated with a normal BMI and
therefore is recommended for normal-weight individuals. This amount of physical
activity leads to an 'active' lifestyle, corresponding to a PAL greater than
1.6 (see Chapter 5). Because the Dietary Reference Intakes are provided for the
general healthy population, recommended levels of physical activity for weight
loss of obese individuals are not provided." (p.880).
Upon the release of this report, many in the press, general public, and
health professions considered that the report had articulated a significant
change in physical activity recommendations for health, with the target now
being 60 minutes of moderate-intensity activity daily rather the 30 minutes or
more that had been promoted since 1995. However, it is very important to
understand that the prior recommendations by CDC, ACSM, NIH, and HHS were based
primarily on the amount of physical activity shown to be consistent with lower
morbidity and mortality rates from selected chronic diseases and all-cause
mortality, and not on the amount for achieving an optimal BMI of 18.5-25.0
kg/m2, which was the major goal of the IOM report. Also, in the IOM
report, the 60-minute recommendation was made in order to achieve all
the identified health benefits fully, while in the other reports, the 30 or
more-minute recommendation was considered a minimum. The other reports
acknowledged that more exercise would bring additional benefits. As with the
prior reports, the IOM document indicated that activity could be accumulated
throughout the day and did not need to be performed only in a single
session.
A key difference in the data considered during the formulation of the
IOM recommendation versus other previous physical activity recommendations was
the IOM panel's emphasis on doubly-labeled water studies. Combining data from
available doubly-labeled water studies, the panel estimated the total daily
energy expenditure of men and women who had a BMI of 18.5 to 25.0
kg/m2. They determined that these subjects had an average PAL of
about 1.75. The panel then took the PAL of people considered to be sedentary
(1.25) and that of people considered to be of normal weight (1.75) then
calculated the difference in PAL between people who were sedentary and those
who were normal weight and converted this to minutes per day of
moderate-intensity activity. Not taken into this consideration was the fact
that the PAL for the subjects in the doubly-labeled water studies who were
overweight or obese was not 1.25 but in the 1.59 to 1.85 range (50). These cross-sectional data do not deal with the question
of how much added exercise will produce a meaningful change in body weight.
The IOM selection of a target activity level of 60 minutes per day or a
PAL of 1.6 or greater to maintain optimal body weight is somewhat less than the
target PAL of 1.75 in the 1998 report by the World Health Organization,
Obesity: Preventing and Managing the Global Epidemic (51). In this extensive report, the authors stated that
analyses of more than 40 national physical activity studies worldwide show a
significant relationship between the average BMI of adult men and their PAL,
with the likelihood of becoming overweight being substantially reduced at PALs
of 1.8 or above. For women, the PAL associated with a healthy weight was
approximately 1.6. Therefore, the WHO report suggested "that people should
remain physically active throughout life and sustain a PAL of 1.75 or more in
order to avoid excessive weight gain" (p.124).
In 2002, an international group of scientists with expertise in physical
activity, nutrition, energy balance and obesity held a consensus meeting
convened by the International Association for the Study of Obesity to assess
"how much physical activity is enough to prevent unhealthy weight gain" (52). Part of their conclusion was that, "The current physical
activity guideline for adults of 30 minutes of moderate intensity activity
daily, preferably all days of the week, is of importance for limiting health
risks for a number of chronic diseases, including coronary heart disease and
diabetes. However, for the prevention of weight gain or regain this guideline
is likely to be insufficient for many individuals in the current environment.
There is compelling evidence that prevention of weight regain in formally obese
individuals requires 60 to 90 minutes of moderate intensity activity or lesser
amounts of vigorous activity. Although definitive data are lacking, it seems
likely that moderate intensity activity of approximately 45 to 60 minutes per
day or 1.7 PAL is required to prevent the transition to overweight or obesity"
(page 101). This consensus statement recognized that the amount of physical
activity associated with lower chronic disease mortality rates is very likely
less than that needed in the current environment to prevent unhealthy weight
gain or regain in many adults.
Dietary Guidelines for Americans, 2005
Every 5 years, the USDA and HHS are required by the US Congress to
prepare Dietary Guidelines for Americans. The Guidelines published in
1995 and 2000 recognized that a physically active lifestyle should be
maintained for optimal health, but no specific guideline focused on prevention
of weight gain or weight loss. For example, in 2000 the recommendations were
highly consistent with the 1995 CDC/ACSM report directed to improving general
health status: "Aim to accumulate at least 30 minutes (adults) or 60 minutes
(children) of moderate intensity activity on most days of the week, preferably
daily. If you already get 30 minutes of physical activity daily, you can gain
even more health benefits by increasing the amount of time you are physically
active or by taking part in more vigorous activities. No matter what activity
you choose, you can do it all at once, or spread it out over two or three times
per day" (53), p.10.
The 2005 Dietary Guidelines for Americans structured the
physical activity recommendations to separate advice about chronic disease
prevention from advice about the amount of physical activity required for the
prevention of unhealthy weight gain or regain or achieving weight loss in
adults (54). They took the generally accepted position
that a variety of health benefits are derived from at least 30 minutes of
moderate-intensity exercise on most days, and separated this recommendation
from the less well documented and understood recommendations regarding the
amount of physical activity required to prevent unhealthy weight gain or regain
and weight loss. The physical activity recommendations needed to help manage
body weight were adopted in large part from the 2002 IOM report (49), which had primarily considered cross-sectional data from
doubly-labeled water studies of energy expenditure (55).
To help adults manage body weight and prevent gradual unhealthy weight gain,
the Guidelines recommended approximately 60 minutes of
moderate/vigorous activity on most days of the week (while not exceeding
calorie requirements). To help adults lose weight and to sustain weight loss,
the Guidelines recommended at least 60 to 90 minutes of daily
moderate-intensity physical activity daily (while not exceeding calorie
requirements). These two recommendations regarding weight gain prevention and
weight loss received the most attention and contributed to some confusion among
the public.
2007 American College of Sports Medicine
and American Heart Association Physical Activity Recommendations
In 2002, the ACSM and CDC organized an expert panel to consider whether
the 1995 CDC/ACSM physical activity and public health recommendations needed to
be updated (8). Key reasons for this consideration included
new scientific evidence since 1995 relating physical activity to health,
physical activity recommendations by various organizations in the interim that
appeared to be in conflict with the 1995 recommendations, and communications
issues related to certain terminology used in the 1995 report. The panel
decided that an update would be of value to health professionals and the
public, and two writing groups were formed, one to prepare recommendations for
adults (18 to 65 years) and another for older adults (older than 65 years). The
purpose of these reports was to update and clarify the 1995 recommendations on
the types and amounts of physical activity needed by healthy adults and older
adults to improve and maintain health. These groups reviewed advances in
pertinent physiologic, epidemiologic, and clinical scientific data, including
primary research articles and reviews published since the original
recommendation was issued in 1995.
The writing groups prepared the two manuscripts, intending that the
recommendations would represent an update from CDC and ACSM. However, after
extensive review at CDC and HHS, it was decided that because physical activity
recommendations for adults had been published as part of the 2005 Dietary
Guidelines for Americans that CDC should not issue additional physical
activity recommendations. ACSM representatives then asked the AHA to
participate in issuing the updated recommendations, and the two sets of
recommendations were published in 2007 (56;57). No major changes were made in the recommendations either
for adults or older adults but a number of features about the type and amount
of activity most likely to provide various benefits were clarified. Also,
issues regarding the role of physical activity in body weight management were
addressed and resistance exercise was made part of the core recommendation for
all adults.
Primary recommendations for adults included the following:
- To promote and maintain health, all healthy adults aged 18 to 65
years need moderate-intensity aerobic (endurance) physical activity for a
minimum of 30 minutes on 5 days each week or vigorous-intensity aerobic
physical activity for a minimum of 20 minutes on 3 days each week. Combinations
of moderate- and vigorous-intensity activity can be performed to meet this
recommendation. For example, a person can meet the recommendation by walking
briskly for 30 minutes twice during the week and then jogging for 20 minutes on
2 other days. Moderate‑intensity aerobic activity, which is generally
equivalent to a brisk walk and noticeably accelerates the heart rate, can be
accumulated toward the 30-minute minimum by performing bouts each lasting 10 or
more minutes. Vigorous-intensity activity is exemplified by jogging, and causes
rapid breathing and a substantial increase in heart rate.
- In addition, every adult should perform activities that maintain or
increase muscular strength and endurance a minimum of 2 days each week. Because
of the dose-response relation between physical activity and health, persons who
wish to further improve their personal fitness, reduce their risk for chronic
diseases and disabilities or prevent unhealthy weight gain may benefit by
exceeding the minimum recommended amounts of physical activity.
The recommendations for older adults are very similar to the updated
ACSM/AHA recommendations for adults, but have several important differences.
For example, the recommended intensity of aerobic activity takes into account
the older adult's aerobic fitness, activities that maintain or increase
flexibility are recommended, and balance exercises are recommended for older
adults at risk of falls. In addition, older adults are encouraged to have an
activity plan for achieving recommended physical activity that integrates
preventive and therapeutic recommendations. The promotion of physical activity
in older adults places more emphasis on moderate-intensity aerobic activity,
muscle-strengthening activity, reducing sedentary behavior, and risk
management.
Reference List
- Troiano RP, Berrigan D, Dodd KW, Masse LC, Tilert
T, McDowell M. Physical activity in the United States measured by
accelerometer. Med.Sci.Sports Exerc. 2008 Jan;40(1):181-8.
- Matthews CE, Chen KY, Freedson PS, Buchowski MS,
Beech BM, Pate RR, Troiano RP. Amount of time spent in sedentary behaviors in
the United States, 2003-2004. Am.J.Epidemiol. 2008 Apr 1;167(7):875-81.
- Hagstromer M, Oja P, Sjostrom M. Physical activity
and inactivity in an adult population assessed by accelerometry. Med.Sci.Sports
Exerc. 2007 Sep;39(9):1502-8.
- Blair SN, Kohl HW, III, Paffenbarger RS, Jr., Clark DG, Cooper KH,
Gibbons LW. Physical fitness and all-cause mortality. A prospective study of
healthy men and women. JAMA 1989 Nov 3;262(17):2395-401.
- Eaton DK, Kann L, Kinchen S, Ross J, Hawkins J,
Harris WA, Lowry R, McManus T, Chyen D, Shanklin S, et al. Youth risk behavior
surveillance--United States, 2005. MMWR Surveill Summ. 2006 Jun
9;55(5):1-108.
- BRESLOW L, Buel P. Mortality from coronary heart
disease and physical activity of work in California. J.Chron.Dis.
1960;11(428):444.
- Howley ET. Type of activity: resistance, aerobic
and leisure versus occupational physical activity. Med.Sci.Sports Exerc. 2001
Jun;33(6 Suppl):S364-S369.
- Pate RR, Pratt M, Blair SN, Haskell WL, Macera CA,
Bouchard C, Buchner D, Ettinger W, Heath GW, King AC, et al. Physical activity
and public health. A recommendation from the Centers for Disease Control and
Prevention and the American College of Sports Medicine. JAMA 1995 Feb
1;273(5):402-7.
- Ainsworth BE, Haskell WL, Whitt MC, Irwin ML,
Swartz AM, Strath SJ, O'Brien WL, Bassett DR, Jr., Schmitz KH, Emplaincourt PO,
et al. Compendium of physical activities: an update of activity codes and MET
intensities. Med.Sci.Sports Exerc. 2000 Sep;32(9 Suppl):S498-S504.
- American College of Sports Medicine., Armstrong
LE, Brubaker PH, Whaley MH, Otto RM. ACSM's guidelines for exercise testing and
prescription. Baltimore: Lippincott Williams & Wilkins; 2005.
- United States.Public Health Service.Office of the
Surgeon General., National Center for Chronic Disease Prevention and Health
Promotion (, President's Council on Physical Fitness and Sports (. Physical
activity and health : a report of the Surgeon General. Atlanta, Ga.;
[Washington, D.C.]; Pittsburgh, PA: U.S. Dept. of Health and Human Services,
Centers for Disease Control and Prevention, National Center for Chronic Disease
Prevention and Health Promotion ; President's Council on Physical Fitness and
Sports ; For sale by the Supt. of Docs.; 1996.
- Brownson RC, Boehmer TK, Luke DA. Declining rates
of physical activity in the United States: what are the contributors?
Annu.Rev.Public Health 2005;26:421-43.
- Prevalence of regular physical activity among
adults--United States, 2001 and 2005. MMWR Morb.Mortal.Wkly.Rep. 2007 Nov
23;56(46):1209-12.
- Centers for Disease Control and Prevention. Data
2010: the Healthy People 2010 Database 2008 Apr Available from
http://wonder.cdc.gov/data2010.
- Lee IM. Epidemiologic methods in physical
activity studies. New York: Oxford University Press; 2008.
- American Heart Association.Committee on Exercise.
Exercise testing and training of apparently healthy individuals : a handbook
for physicians. Dallas, Tex.: American Heart Assoc.; 1972.
- American Heart Association.Committee on Exercise.
Exercise testing and training of individuals with heart disease or at high risk
for its development : a handbook for physicians. Dallas, Tex.: American Heart
Association; 1975.
- Pollock ML. The quantification of endurance
training programs. Exerc.Sport Sci.Rev. 1973;1:155-88.
- American College of Sports Medicine position
statement on the recommended quantity and quality of exercise for developing
and maintaining fitness in healthy adults. Med.Sci.Sports
1978;10(3):vii-vix.
- American College of Sports Medicine position
stand. The recommended quantity and quality of exercise for developing and
maintaining cardiorespiratory and muscular fitness in healthy adults.
Med.Sci.Sports Exerc. 1990 Apr;22(2):265-74.
- American College of Sports Medicine Position
Stand. The recommended quantity and quality of exercise for developing and
maintaining cardiorespiratory and muscular fitness, and flexibility in healthy
adults. Med.Sci.Sports Exerc. 1998 Jun;30(6):975-91.
- American College of Sports Medicine. Guidelines
for graded exercise testing and exercise prescription. Philadelphia: Lea &
Febiger; 1975.
- American College of Sports Medicine. Guidelines
for graded exercise testing and exercise prescription. Philadelphia: Lea &
Febiger; 1980.
- American College of Sports Medicine., American
College of Sports Medicine. Guidelines for exercise testing and prescription.
Philadelphia: Lea & Febiger; 1986.
- American College of Sports Medicine. Guidelines
for exercise testing and prescription. Philadelphia: Lea & Febiger;
1991.
- American College of Sports Medicine, Kenney WL,
Humphrey RH, Bryant CX, Mahler DA. ACSM's guidelines for exercise testing and
prescription. Baltimore, Md.: Williams & Wilkins; 1995.
- American College of Sports Medicine., Franklin
BA, Whaley MH, Howley ET, Balady GJ. ACSM's guidelines for exercise testing and
prescription. Philadelphia: Lippincott Williams & Wilkins; 2000.
- Fletcher GF, Froelicher VF, Hartley LH, Haskell
WL, Pollock ML. Exercise standards. A statement for health professionals from
the American Heart Association. Circulation 1990 Dec;82(6):2286-322.
- Haskell WL. Physical activity and health: need to
define the required stimulus. Am.J.Cardiol. 1985 Apr 26;55(10):4D-9D.
- Mason JO, Powell KE. Physical activity,
behavioral epidemiology, and public health. Public Health Rep. 1985
Mar;100(2):113-5.
- Powell KE, Paffenbarger RS, Jr. Workshop on
Epidemiologic and Public Health Aspects of Physical Activity and Exercise: a
summary. Public Health Rep. 1985 Mar;100(2):118-26.
- Haskell WL. J.B. Wolffe Memorial Lecture. Health
consequences of physical activity: understanding and challenges regarding
dose-response. Med.Sci.Sports Exerc. 1994 Jun;26(6):649-60.
- Leon AS, Connett J, Jacobs DR, Jr., Rauramaa R.
Leisure-time physical activity levels and risk of coronary heart disease and
death. The Multiple Risk Factor Intervention Trial. JAMA 1987 Nov
6;258(17):2388-95.
- Shaper AG, Wannamethee G, Weatherall R. Physical
activity and ischaemic heart disease in middle-aged British men. Br.Heart J.
1991 Nov;66(5):384-94.
- Gossard D, Haskell WL, Taylor CB, Mueller JK,
Rogers F, Chandler M, Ahn DK, Miller NH, DeBusk RF. Effects of low- and
high-intensity home-based exercise training on functional capacity in healthy
middle-aged men. Am.J.Cardiol. 1986 Feb 15;57(6):446-9.
- Duncan JJ, Gordon NF, Scott CB. Women walking for
health and fitness. How much is enough? JAMA 1991 Dec 18;266(23):3295-9.
- Marceau M, Kouame N, Lacourciere Y, Cleroux J.
Effects of different training intensities on 24-hour blood pressure in
hypertensive subjects. Circulation 1993 Dec;88(6):2803-11.
- International Conference on Exercise FaH,
Bouchard C. Exercise, fitness, and health : a consensus of current knowledge.
In Champaign, Ill.: Human Kinetics Books; 1990.
- Bouchard C, Shephard RJ, Stephens T. Physical
activity, fitness, and health. In Champaign, IL; Leeds: Human Kinetics
Publishers; 1993.
- Fletcher GF, Blair SN, Blumenthal J, Caspersen C,
Chaitman B, Epstein S, Falls H, Froelicher ES, Froelicher VF, Pina IL.
Statement on exercise. Benefits and recommendations for physical activity
programs for all Americans. A statement for health professionals by the
Committee on Exercise and Cardiac Rehabilitation of the Council on Clinical
Cardiology, American Heart association. Circulation 1992 Jul;86(1):340-4.
- Thompson PD, Buchner D, Pina IL, Balady GJ,
Williams MA, Marcus BH, Berra K, Blair SN, Costa F, Franklin B, et al. Exercise
and physical activity in the prevention and treatment of atherosclerotic
cardiovascular disease: a statement from the Council on Clinical Cardiology
(Subcommittee on Exercise, Rehabilitation, and Prevention) and the Council on
Nutrition, Physical Activity, and Metabolism (Subcommittee on Physical
Activity). Circulation 2003 Jun 24;107(24):3109-16.
- Cooper KH. Aerobics. New York: M. Evans;
distributed in association with Lippincott, Philadelphia; 1968.
- Ebisu t. Splitting the distance of endurance
runnning on cardiovascular endurance and blood lipids. Jpn.J.Phys.Ed.
1985;30:37-43.
- DeBusk RF, Stenestrand U, Sheehan M, Haskell WL.
Training effects of long versus short bouts of exercise in healthy subjects.
Am.J.Cardiol. 1990 Apr 15;65(15):1010-3.
- Jakicic JM, Wing RR, Butler BA, Robertson RJ.
Prescribing exercise in multiple short bouts versus one continuous bout:
effects on adherence, cardiorespiratory fitness, and weight loss in overweight
women. Int.J.Obes.Relat Metab Disord. 1995 Dec;19(12):893-901.
- Physical activity and cardiovascular health. NIH
Consensus Development Panel on Physical Activity and Cardiovascular Health.
JAMA 1996 Jul 17;276(3):241-6.
- Exercise for health. WHO/FIMS Committee on
Physical Activity for Health. Bull.World Health Organ 1995;73(2):135-6.
- Bouchard C. Physical activity and health:
introduction to the dose-response symposium. Med.Sci.Sports Exerc. 2001
Jun;33(6 Suppl):S347-S350.
- Institute of Medicine (. Dietary reference
intakes for energy, carbohydrate, fiber, fat, fatty acids, cholesterol, protein
and amino acids. Washington, D.C.: National Academy Press; 2002.
- Blair SN, LaMonte MJ, Nichaman MZ. The evolution
of physical activity recommendations: how much is enough? Am.J.Clin.Nutr. 2004
May;79(5):913S-20S.
- WHO Consultation on Obesity. Obesity : preventing
and managing the global epidemic : report of a WHO Consultation on Obesity,
Geneva, 3-5 June 1997. Geneva: World Health Organization, Division of
Noncommunicable Disease, Programme of Nutrition Family and Reproductive Health;
1998.
- Saris WH, Blair SN, van Baak MA, Eaton SB, Davies
PS, Di PL, Fogelholm M, Rissanen A, Schoeller D, Swinburn B, et al. How much
physical activity is enough to prevent unhealthy weight gain? Outcome of the
IASO 1st Stock Conference and consensus statement. Obes.Rev. 2003
May;4(2):101-14.
- United States.Dept.of Agriculture., United
States.Dept.of Health and Human Services. Nutrition and your health : dietary
guidelines for Americans. [Washington, DC]: U.S. Dept. of Agriculture : U.S.
Dept. of Health and Human Services : [For sale by the U.S. G.P.O., Supt. of
Docs.]; 2000.
- United States.Dept.of Health and Human Services.,
United States.Dept.of Agriculture., United States.Dietary Guidelines Advisory
Committee. Dietary guidelines for Americans, 2005 2005 Available from
http://purl.access.gpo.gov/GPO/LPS57108.
- Brooks GA, Butte NF, Rand WM, Flatt JP, Caballero
B. Chronicle of the Institute of Medicine physical activity recommendation: how
a physical activity recommendation came to be among dietary recommendations.
Am.J.Clin.Nutr. 2004 May;79(5):921S-30S.
- Haskell WL, Lee IM, Pate RR, Powell KE, Blair SN,
Franklin BA, Macera CA, Heath GW, Thompson PD, Bauman A. Physical activity and
public health: updated recommendation for adults from the American College of
Sports Medicine and the American Heart Association. Med.Sci.Sports Exerc. 2007
Aug;39(8):1423-34.
- Nelson ME, Rejeski WJ, Blair SN, Duncan PW, Judge
JO, King AC, Macera CA, Castaneda-Sceppa C. Physical activity and public health
in older adults: recommendation from the American College of Sports Medicine
and the American Heart Association. Med.Sci.Sports Exerc. 2007
Aug;39(8):1435-45.
[1] This overview of the
development of physical activity guidelines in the United States was adapted
from a chapter prepared by W. Haskell for Epidemiologic Methods in Physical
Activity (15). Its use in this report was approved by
the publisher.
top of page
Continue to E. Integration and Summary of
the Science
Back to C. Key Terms
Back
to Physical Activity Guidelines Advisory Committee
Report
|