«« Back to the Enforcement Activity Page
OSHA Enforcement: Striving for Safe and Healthy Workplaces
OSHA's purpose is to reduce workplace fatalities, injuries, and illnesses
by promoting workplace safety and health. Although OSHA must continually respond to new
challenges from emerging industries, new technologies, and an ever-changing workforce, the
overall mission remains the same. Strategic mechanisms such as Site Specific Targeting (SST),
Local Emphasis Programs (LEPs), National Emphasis Programs (NEPs), and the Enhanced Enforcement
Program (EEP) have been designed to aid OSHA in fulfilling that purpose.
OSHA's enforcement programs remain focused and efficient. Although there are many
components to OSHA's effort, and multiple intermediate measures of its effectiveness,
the most meaningful indicator of OSHA's success is the number of employees who go home
every day healthy and uninjured.
Enhanced Enforcement Program: Continued Success in FY2007
The Agency's Enhanced Enforcement Program (EEP) targets employers who, despite OSHA's
enforcement and outreach efforts, repeatedly ignore their OSH Act obligations and place their
employees at risk. The EEP focuses on cases with extremely serious violations related either
to a fatality or to multiple willful or repeated violations. If an inspection is classified
as an EEP case, then it may receive, among other things, follow-up inspections, inspections
of other workplaces of that employer, and more stringent settlement provisions. During the
first four years (FY2004-2007) of the program, OSHA identified an average of 524 inspections
per year that qualified as EEP cases. In FY2007, OSHA identified 719 EEP cases, a record high.
Local Emphasis Programs: Targeted Strategy and Localized Expertise
Local Emphasis Programs (LEPs) are enforcement strategies designed and implemented at the
Regional Office and/or Area Office levels. Nationwide, there are over 150 individual programs
(sometimes implemented by multiple offices) that address a wide range of industries and hazards
such as:
- Logging
- Grain Handling
- Overhead Power Lines
- Bridge and Tunnel Construction
- Residential Construction
- Meat Packing
- Powered Industrial Trucks
- Auto Body Shops
- Commercial Diving
- Electroplating
During FY2007, OSHA conducted 21,824 inspections (out of 39,324 total inspections) that were
related to an LEP. Incorporating localized expertise and knowledge to target specific
industries and hazards allows for more efficient use of OSHA's resources.
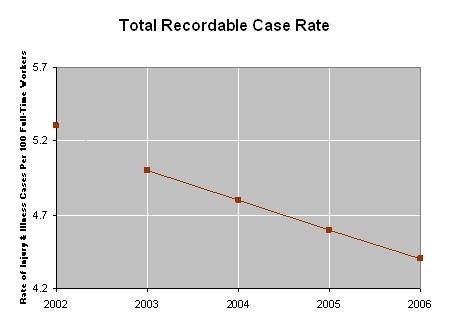
Injury and Illness Rates: Record Lows in FY2007
The continued decline in the total recordable and lost workday case rates indicates that fewer
American employees encountered safety or health hazards resulting in serious injuries or
illnesses. The rates for calendar year 2006, reported on October 16, 2007, were the lowest
that BLS has ever reported. Not only has the rate at which employees experienced a recordable
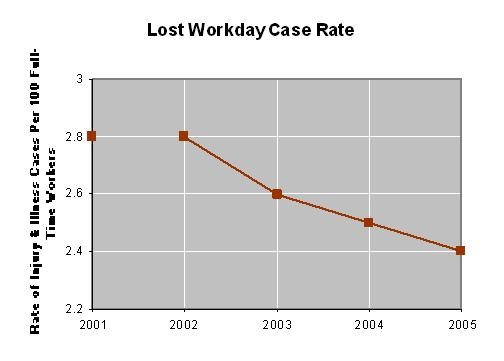
injury decreased by 12.0% since calendar year 2003, but the lost workday case rate, the measure
of cases in which employees were absent from work, restricted, or transferred as a result of a
workplace injury or illness, has also declined by 11.5% over the same period.
| Injury and Illness Rates1,2 |
2003 |
2004 |
2005 |
2006 |
% Reduction 2002-2006 |
| Total Recordable Case Rate |
5.0 |
4.8 |
4.6 |
4.4 |
-12.0% |
| Lost Workday Case Rate |
2.6 |
2.5 |
2.4 |
2.3 |
-11.5% |
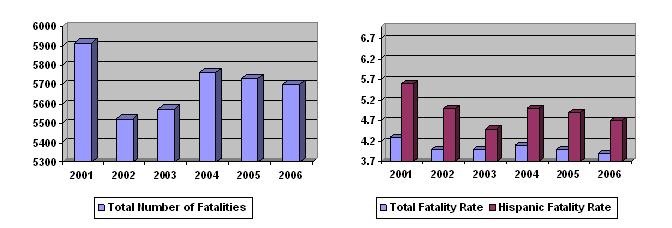
Workplace Fatality Rate: An All-Time Low
OSHA continues to aggressively pursue the reduction of workplace fatalities through
implementation of its Strategic Management Plan (http://www.dol.gov/%5Fsec/stratplan). During the most
recent year for which data is available, calendar year 2006, the rate of fatal work injuries
was 4.0 fatalities per 100,000 employees. This rate matches the all-time low achieved since
the Bureau of Labor Statistics (BLS) instituted its Census of Fatal Occupational Injuries in
1992.
OSHA continues to broaden its efforts to reach at-risk Hispanic employees. Targeted initiatives
include Spanish-language publications available in print and on OSHA's website along with other
compliance assistance information. Additionally, OSHA's Local Emphasis Programs (LEPs) target
industries, such as construction, in which Hispanic employees are significantly represented.
As a result, the fatality rate for Hispanic workers has decreased by nearly 17 percent since
2001.
| Fatality Statistics |
2001 |
2002 |
2003 |
2004 |
2005 |
2006 |
% Reduction
2001-2006 |
| Total Number of Fatalities |
5,915 |
5,524 |
5,575 |
5,764 |
5,734 |
5,840 |
-1.3% |
| Fatality Rate3 |
4.3 |
4.0 |
4.0 |
4.1 |
4.0 |
4.0 |
-7.0% |
| Hispanic Fatality Rate3 |
6.0 |
5.0 |
4.5 |
5.0 |
4.9 |
5.0 |
-16.7% |
OSHA Inspection Activity: Focused and Efficient
By proactively targeting the industries and employers that experience the greatest number of
workplace injuries and illnesses, OSHA continues to maintain its high level of annual inspection
activity. In FY2007, OSHA conducted 39,324 total inspections. This total represents 4.3% more
inspections than OSHA's stated goal of 37,700. This year's significant enforcement action
included over one hundred inspections that each resulted in a total proposed monetary penalty
of over $100,000. Programmed inspections also showed a 2.7% increase over the same period.
Furthermore, in FY2007, OSHA conducted 16,288 unprogrammed inspections, including employee
complaints, accidents, and referrals, thus demonstrating OSHA's firm commitment to be continually
responsive to employee concerns related to workplace safety and health. By fostering good
working relationships with state, local, and other federal authorities, OSHA experienced a
significant 12.0% increase over the past five fiscal years in the number of inspections generated
through referrals from other governmental agencies. Additionally, the number of fatality
investigations decreased as compared to the previous fiscal year and represented only a slight
increase over the past five fiscal years.
| OSHA Inspection Statistics |
FY2003 |
FY2004 |
FY2005 |
FY2006 |
FY2007 |
% Change
2003-2007 |
| Total Inspections |
39,817 |
39,167 |
38,714 |
38,579 |
39,324 |
-1.2% |
| Total Programmed Inspections |
22,436 |
21,576 |
21,404 |
21,506 |
23,035 |
2.7% |
| Total Unprogrammed Inspections |
17,381 |
17,590 |
17,310 |
17,073 |
16,288 |
-6.3% |
| Fatality Investigations |
1,021 |
1,060 |
1,114 |
1,081 |
1,043 |
2.2% |
| Complaints |
7,969 |
8,062 |
7,716 |
7,376 |
7,055 |
-11.5% |
| Referrals |
4,472 |
4,585 |
4,787 |
5,019 |
5,007 |
12.0% |
| Other |
3,880 |
3,829 |
4,807 |
3,555 |
3,183 |
-18.0% |
Hazards Identified: Total Violations Rise; Serious and Repeat Violations Increase
In FY2007, 88,846 violations of OSHA's standards and regulations were found in the nation's
workplaces, a 6.4 percent increase since FY2003. The number of willful violations, while a
decrease from the previous year, still represents an increase of 2.7 percent over the past five
fiscal years. The number of both serious and repeat violations issued increased significantly
over the previous fiscal year, as well as over the past five fiscal years. The considerable
increases in these types of violations demonstrate OSHA's commitment to identifying and
eliminating a greater number of serious hazards in the workplace, as well as identifying more
employers who have repeatedly violated OSHA standards.
| OSHA Violation Statistics |
FY2003 |
FY2004 |
FY2005 |
FY2006 |
FY2007 |
% Change
2003-2007 |
| Total Violations |
83,539 |
86,708 |
85,307 |
83,913 |
88,846 |
6.4% |
| Total Serious Violations |
59,861 |
61,666 |
61,018 |
61,337 |
67,176 |
12.2% |
| Total Willful Violations |
404 |
462 |
747 |
479 |
415 |
2.7 |
| Total Repeat Violations |
2,147 |
2,360 |
2,350 |
2,551 |
2,714 |
26.4% |
| Total Other-than-Serious |
20,552 |
21,705 |
20,819 |
19,246 |
18,331 |
-10.8% |
Whistleblower Complaint Protection: Integral to OSHA's Mission
Section 11(c) of the Act prohibits reprisals, in any form, against employees who exercise
rights under the Act. The administration of Section 11(c) is thus integral to OSHA's core
mission. In FY2007, OSHA completed 1,163 investigations of 11(c) complaints. Twenty-two
percent were meritorious complaints, 95% of which resulted in settlements. Sixty-four percent
of the complaints were dismissed, and 15% were withdrawn.
The twenty-six state programs completed 1,022 whistleblower investigations. Twenty-four
percent were meritorious, 86% of which resulted in settlements. Fifty-nine percent of the
complaints were dismissed, and 17% were withdrawn.
Summary
OSHA's enforcement efforts remain critical to workplace safety and health by targeting the
most hazardous workplaces and the employers that have the highest injury and illness rates.
Innovative approaches such as the EEP, LEPs, and NEPs enable OSHA to effectively identify
serious safety and health hazards, to address recalcitrant employers, and to efficiently use
its resources. OSHA's continual focus on its bottom line, reducing workplace injuries,
illnesses, and fatalities, adds value to the workplace for both employers and employees.
1Rates reflect number of cases per 100 full-time employees.
[Back to Text]
2Rates are for private industry employers.
[Back to Text]
3Rates reflect number of fatalities per 100,000 full-time employees.
[Back to Text]
|
