| GENERAL ADMINISTRATION BUDGET* 1975 - 2003 |
|||||||||||||
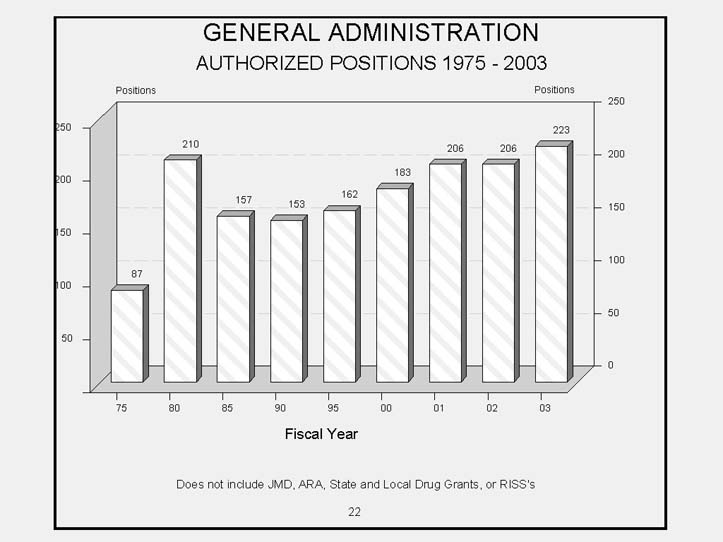
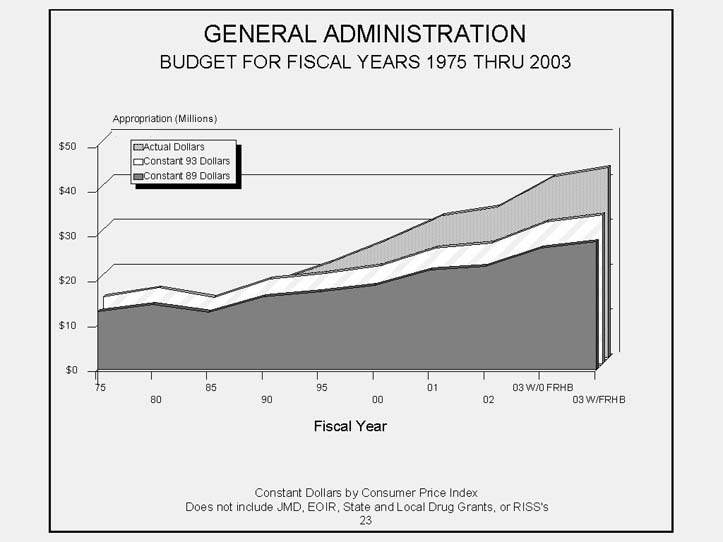
| FISCAL YEAR | POSITIONS | GA BUDGET (Millions) |
CPI INDEXED TO 1993 |
GA BUDGET IN 1993 $ (Millions) |
GA BUDGET REAL PERCENT GROWTH FROM 1993 |
GA BUDGET APPARENT PERCENT GROWTH FROM 1993 |
|||||||
|---|---|---|---|---|---|---|---|---|---|---|---|---|---|
| 1975 | 87 | 5.6 | 37.4 | 15.0 | -31.7 | -74.5 | |||||||
| 1976 | 104 | 3.6 | 39.6 | 9.1 | -58.5 | -83.6 | |||||||
| 1977 | 99 | 4.5 | 42.1 | 10.7 | -51.3 | -79.5 | |||||||
| 1978 | 149 | 6.9 | 45.3 | 15.2 | -30.6 | -68.5 | |||||||
| 1979 | 192 | 8.4 | 50.4 | 16.7 | -24.1 | -61.7 | |||||||
| 1980 | 210 | 9.7 | 57.3 | 16.9 | -22.8 | -55.8 | |||||||
| 1981 | 194 | 10.0 | 63.2 | 15.8 | -27.9 | -54.4 | |||||||
| 1982 | 152 | 9.0 | 67.1 | 13.4 | -38.8 | -59.0 | |||||||
| 1983 | 152 | 11.1 | 69.2 | 16.0 | -26.9 | -49.4 | |||||||
| 1984 | 157 | 10.8 | 72.2 | 15.0 | -31.8 | -50.8 | |||||||
| 1985 | 157 | 11.1 | 74.8 | 14.8 | -32.3 | -49.4 | |||||||
| 1986 | 157 | 13.1 | 76.2 | 17.2 | -21.6 | -40.3 | |||||||
| 1987 | 157 | 13.1 | 79.0 | 16.6 | -24.1 | -40.1 | |||||||
| 1988 | 157 | 15.1 | 82.1 | 18.4 | -16.2 | -31.2 | |||||||
| 1989 | 157 | 15.3 | 85.9 | 17.8 | -19.0 | -30.4 | |||||||
| 1990 | @ | 153 | 17.1 | 91.2 | 18.8 | -14.3 | -21.9 | ||||||
| 1991 | @ | 159 | 19.3 | 94.5 | 20.4 | -7.0 | -12.1 | ||||||
| 1992 | @ | 175 | 21.9 | 97.4 | 22.5 | 2.6 | -0.1 | ||||||
| 1993 | @ | 175 | 21.9 | 100.0 | 21.9 | 0.0 | 0.0 | ||||||
| 1994 | @ | 178 | 24.6 | 103.0 | 23.9 | 8.9 | 12.1 | ||||||
| 1995 | 162 | 21.3 | 105.6 | 20.2 | -8.0 | -2.9 | |||||||
| 1996 | # | 161 | 27.2 | 108.7 | 25.0 | 14.2 | 24.2 | ||||||
| 1997 | 181 | 24.5 | 111.1 | 22.0 | 0.4 | 11.6 | |||||||
| 1998 | 183 | 25.4 | 112.8 | 22.5 | 2.7 | 15.9 | |||||||
| 1999 | 183 | 26.2 | 115.7 | 22.6 | 3.2 | 19.5 | |||||||
| 2000 | 183 | 26.2 | 119.8 | 21.9 | -0.3 | 19.5 | |||||||
| 2001 | R | 206 | 31.7 | 122.9 | 25.8 | 17.6 | 44.5 | ||||||
| 2002 | 206 | 33.6 | 125.1 | 26.9 | 22.4 | 53.2 | |||||||
| 2003 W/O FRHB | 223 | 40.4 | 127.9 | 31.6 | 44.1 | 84.2 | |||||||
| 2003 W/ FRHB | 223 | 42.5 | 127.9 | 33.2 | 51.5 | 93.8 | |||||||
| GENERAL ADMINISTRATION BUDGET* 1975 - 2003 |
|||||||||||||
| FISCAL YEAR | POSITIONS | GA BUDGET (Millions) |
CPI INDEXED TO 1989 |
GA BUDGET IN 1989 $ (Millions) |
GA BUDGET REAL PERCENT GROWTH FROM 1989 |
GA BUDGET APPARENT PERCENT GROWTH FROM 1989 |
|||||||
|---|---|---|---|---|---|---|---|---|---|---|---|---|---|
| 1975 | 87 | $5.6 | 43.5 | $12.9 | -15.8 | -63.3 | |||||||
| 1976 | 104 | 3.6 | 46.0 | 7.8 | -48.8 | -76.4 | |||||||
| 1977 | 99 | 4.5 | 49.0 | 9.2 | -39.9 | -70.5 | |||||||
| 1978 | 149 | 6.9 | 52.8 | 13.1 | -14.4 | -54.8 | |||||||
| 1979 | 192 | 8.4 | 58.7 | 14.3 | -6.3 | -45.0 | |||||||
| 1980 | 210 | 9.7 | 66.6 | 14.6 | -4.7 | -36.5 | |||||||
| 1981 | 194 | 10.0 | 73.6 | 13.6 | -11.0 | -34.5 | |||||||
| 1982 | 152 | 9.0 | 78.1 | 11.5 | -24.5 | -41.1 | |||||||
| 1983 | 152 | 11.1 | 80.6 | 13.8 | -9.8 | -27.3 | |||||||
| 1984 | 157 | 10.8 | 84.0 | 12.9 | -15.8 | -29.3 | |||||||
| 1985 | 157 | 11.1 | 87.0 | 12.8 | -16.5 | -27.3 | |||||||
| 1986 | 157 | 13.1 | 88.7 | 14.8 | -3.3 | -14.2 | |||||||
| 1987 | 157 | 13.1 | 91.9 | 14.3 | -6.4 | -13.9 | |||||||
| 1988 | 157 | 15.1 | 95.6 | 15.8 | 3.4 | -1.1 | |||||||
| 1989 | 157 | 15.3 | 100.0 | 15.3 | 0.0 | 0.0 | |||||||
| 1990 | @ | 153 | 17.1 | 106.1 | 16.2 | 5.8 | 12.2 | ||||||
| 1991 | @ | 159 | 19.3 | 110.0 | 17.5 | 14.8 | 26.3 | ||||||
| 1992 | @ | 175 | 21.9 | 113.3 | 19.3 | 26.6 | 43.5 | ||||||
| 1993 | @ | 175 | 21.9 | 116.4 | 18.8 | 23.4 | 43.6 | ||||||
| 1994 | @ | 178 | 24.6 | 119.9 | 20.5 | 34.4 | 61.1 | ||||||
| 1995 | 162 | 21.3 | 122.9 | 17.3 | 13.5 | 39.5 | |||||||
| 1996 | # | 161 | 27.2 | 126.6 | 21.5 | 40.9 | 78.3 | ||||||
| 1997 | 181 | 24.5 | 129.3 | 18.9 | 23.9 | 60.2 | |||||||
| 1998 | 183 | 25.4 | 131.3 | 19.4 | 26.8 | 66.4 | |||||||
| 1999 | 183 | 26.2 | 134.7 | 19.5 | 27.4 | 71.6 | |||||||
| 2000 | 183 | 26.2 | 139.4 | 18.8 | 23.1 | 71.6 | |||||||
| 2001 | R | 206 | 31.7 | 143.0 | 22.2 | 45.1 | 107.6 | ||||||
| 2002 | 206 | 33.6 | 145.6 | 23.1 | 51.1 | 120.0 | |||||||
| 2003 W/O FRHB | 223 | 40.4 | 148.8 | 27.1 | 77.8 | 164.5 | |||||||
| 2003 W/ FRHB | 223 | 42.5 | 148.8 | 28.6 | 87.0 | 178.3 | |||||||