| FEDERAL PRISON SYSTEM - SALARIES AND EXPENSES
BUDGET 1975 - 2003 |
|||||||||||||
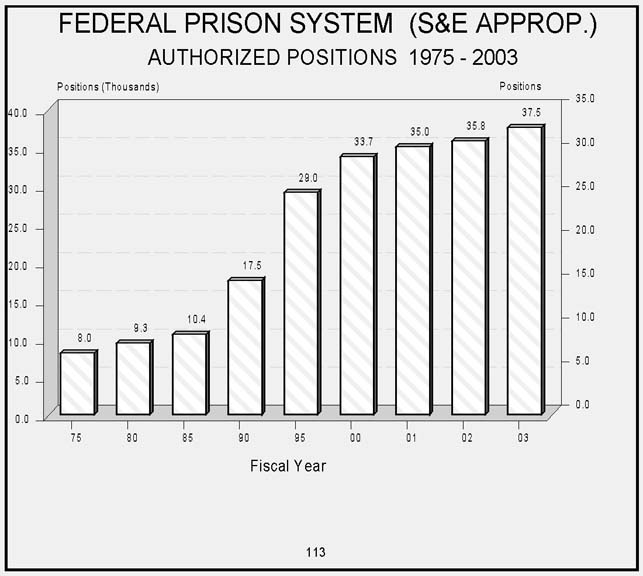
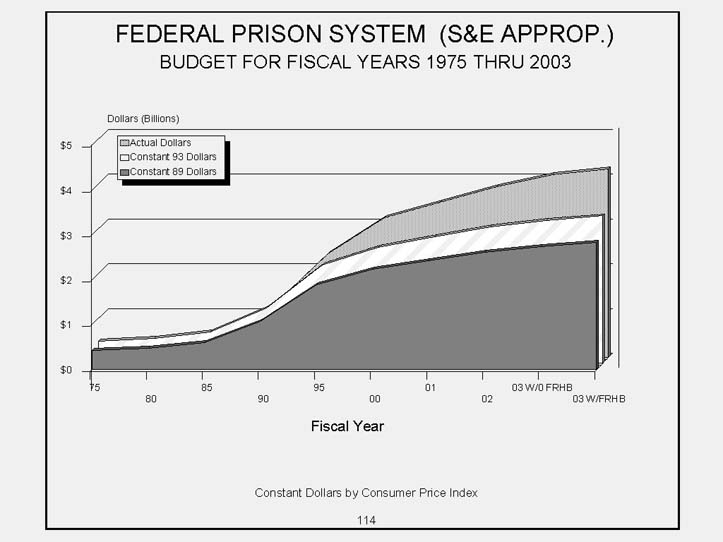
| FISCAL YEAR | POSITIONS | S&E BUDGET (Millions) |
CPI INDEXED TO 1993 |
S&E BUDGET IN 1993 $ (Millions) |
S&E BUDGET REAL PERCENT GROWTH FROM 1993 |
S&E BUDGET APPARENT PERCENT GROWTH FROM 1993 |
|||||||
|---|---|---|---|---|---|---|---|---|---|---|---|---|---|
| 1975 | 8,031 | 183.3 | 37.4 | 490.1 | -72.5 | -89.7 | |||||||
| 1976 | 8,098 | 214.4 | 39.6 | 541.9 | -69.6 | -88.0 | |||||||
| 1977 | 8,233 | 241.7 | 42.1 | 573.9 | -67.8 | -86.4 | |||||||
| 1978 | 8,637 | 269.6 | 45.3 | 594.6 | -66.7 | -84.9 | |||||||
| 1979 | 9,376 | 303.5 | 50.4 | 601.7 | -66.3 | -83.0 | |||||||
| 1980 | 9,313 | 317.4 | 57.3 | 554.3 | -68.9 | -82.2 | |||||||
| 1981 | 9,160 | 341.9 | 63.2 | 540.9 | -69.7 | -80.8 | |||||||
| 1982 | 8,952 | 366.8 | 67.1 | 546.8 | -69.3 | -79.4 | |||||||
| 1983 | 9,085 | 401.2 | 69.2 | 579.5 | -67.5 | -77.5 | |||||||
| 1984 | 9,532 | 447.6 | 72.2 | 620.1 | -65.2 | -74.9 | |||||||
| 1985 | 10,441 | 522.9 | 74.8 | 699.4 | -60.8 | -70.7 | |||||||
| 1986 | 10,876 | 551.0 | 76.2 | 723.1 | -59.4 | -69.1 | |||||||
| 1987 | 11,257 | 647.8 | 79.0 | 820.2 | -54.0 | -63.7 | |||||||
| 1988 | 11,760 | 762.4 | 82.1 | 928.2 | -47.9 | -57.2 | |||||||
| 1989 | 15,240 | 952.4 | 85.9 | 1,108.5 | -37.8 | -46.6 | |||||||
| 1990 | 17,471 | 1,128.8 | 91.2 | 1,238.2 | -30.6 | -36.7 | |||||||
| 1991 | 22,100 | 1,353.6 | 94.5 | 1,431.9 | -19.7 | -24.1 | |||||||
| 1992 | 23,461 | 1,638.9 | 97.4 | 1,683.2 | -5.6 | -8.1 | |||||||
| 1993 | & | 24,990 | 1,783.2 | 100.0 | 1,783.2 | 0.0 | 0.0 | ||||||
| 1994 | 25,860 | 1,952.4 | 103.0 | 1,895.5 | 6.3 | 9.5 | |||||||
| 1995 | N | 29,007 | 2,319.7 | 105.6 | 2,197.2 | 23.2 | 30.1 | ||||||
| 1996 | V T | 30,471 | 2,546.9 | 108.7 | 2,342.1 | 31.3 | 42.8 | ||||||
| 1997 | V U | 32,849 | 2,748.4 | 111.1 | 2,473.1 | 38.7 | 54.1 | ||||||
| 1998 | V W | 32,507 | 2,842.1 | 112.8 | 2,519.6 | 41.3 | 59.4 | ||||||
| 1999 | V Y | 32,377 | 2,847.8 | 115.7 | 2,460.6 | 38.0 | 59.7 | ||||||
| 2000 | V Z R | 33,712 | 3,110.6 | 119.8 | 2,596.8 | 45.6 | 74.4 | ||||||
| 2001 | R | 34,984 | 3,469.7 | 122.9 | 2,823.2 | 58.3 | 94.6 | ||||||
| 2002 | 35,770 | 3,808.6 | 125.1 | 3,044.2 | 70.7 | 113.6 | |||||||
| 2003 W/O FRHB | 37,524 | 4081.8 | 127.9 | 3,192.3 | 79.0 | 128.9 | |||||||
| 2003 W/ FRHB | 37,524 | 4208.5 | 127.9 | 3,290.5 | 84.5 | 136.0 | |||||||
| FEDERAL PRISON SYSTEM -
SALARIES AND EXPENSES BUDGET 1975 - 2003 |
|||||||||||||
| FISCAL YEAR | POSITIONS | S&E BUDGET (Millions) |
CPI INDEXED TO 1989 |
S&E BUDGET IN 1989 $ (Millions) |
S&E BUDGET REAL PERCENT GROWTH FROM 1989 |
S&E BUDGET APPARENT PERCENT GROWTH FROM 1989 |
|||||||
|---|---|---|---|---|---|---|---|---|---|---|---|---|---|
| 1975 | 8,031 | 183.3 | 43.5 | 421.1 | -55.8 | -80.8 | |||||||
| 1976 | 8,098 | 214.4 | 46.0 | 465.6 | -51.1 | -77.5 | |||||||
| 1977 | 8,233 | 241.7 | 49.0 | 493.1 | -48.2 | -74.6 | |||||||
| 1978 | 8,637 | 269.6 | 52.8 | 510.9 | -46.4 | -71.7 | |||||||
| 1979 | 9,376 | 303.5 | 58.7 | 517.0 | -45.7 | -68.1 | |||||||
| 1980 | 9,313 | 317.4 | 66.6 | 476.2 | -50.0 | -66.7 | |||||||
| 1981 | 9,160 | 341.9 | 73.6 | 464.8 | -51.2 | -64.1 | |||||||
| 1982 | 8,952 | 366.8 | 78.1 | 469.8 | -50.7 | -61.5 | |||||||
| 1983 | 9,085 | 401.2 | 80.6 | 497.9 | -47.7 | -57.9 | |||||||
| 1984 | 9,532 | 447.6 | 84.0 | 532.8 | -44.1 | -53.0 | |||||||
| 1985 | 10,441 | 522.9 | 87.0 | 601.0 | -36.9 | -45.1 | |||||||
| 1986 | 10,876 | 551.0 | 88.7 | 621.3 | -34.8 | -42.1 | |||||||
| 1987 | 11,257 | 647.8 | 91.9 | 704.7 | -26.0 | -32.0 | |||||||
| 1988 | 11,760 | 762.4 | 95.6 | 797.5 | -16.3 | -19.9 | |||||||
| 1989 | 15,240 | 952.4 | 100.0 | 952.4 | 0.0 | 0.0 | |||||||
| 1990 | 17,471 | 1,128.8 | 106.1 | 1,063.9 | 11.7 | 18.5 | |||||||
| 1991 | 22,100 | 1,353.6 | 110.0 | 1,230.3 | 29.2 | 42.1 | |||||||
| 1992 | 23,461 | 1,638.9 | 113.3 | 1,446.2 | 51.8 | 72.1 | |||||||
| 1993 | & | 24,990 | 1,783.2 | 116.4 | 1,532.2 | 60.9 | 87.2 | ||||||
| 1994 | 25,860 | 1,952.4 | 119.9 | 1,628.7 | 71.0 | 105.0 | |||||||
| 1995 | N | 29,007 | 2,319.7 | 122.9 | 1,887.9 | 98.2 | 143.6 | ||||||
| 1996 | V T | 30,471 | 2,546.9 | 126.6 | 2,012.4 | 111.3 | 167.4 | ||||||
| 1997 | V U | 32,849 | 2,748.4 | 129.3 | 2,124.9 | 123.1 | 188.6 | ||||||
| 1998 | V W | 32,507 | 2,842.1 | 131.3 | 2,164.8 | 127.3 | 198.4 | ||||||
| 1999 | V Y | 32,377 | 2,847.8 | 134.7 | 2,114.2 | 122.0 | 199.0 | ||||||
| 2000 | V Z R | 33,712 | 3,110.6 | 139.4 | 2,231.2 | 134.3 | 226.6 | ||||||
| 2001 | R | 34,984 | 3,469.7 | 143.0 | 2,425.7 | 154.7 | 264.3 | ||||||
| 2002 | 35,770 | 3,808.6 | 145.6 | 2,615.6 | 174.6 | 299.9 | |||||||
| 2003 W/O FRHB | 37,524 | 4081.8 | 148.8 | 2,742.8 | 188.0 | 328.6 | |||||||
| 2003 W/ FRHB | 37,524 | 4208.5 | 148.8 | 2,828.3 | 197.0 | 341.9 | |||||||