| FEDERAL PRISON SYSTEM BUDGET 1975 - 2003 |
|||||||||||||
| FISCAL YEAR | POSITIONS | FPS BUDGET (Millions) |
CPI INDEXED TO 1993 |
FPS
BUDGET IN 1993 $ (Millions) |
FPS
BUDGET REAL PERCENT GROWTH FROM 1993 |
FPS
BUDGET APPARENT PERCENT GROWTH FROM 1993 |
|||||||
|---|---|---|---|---|---|---|---|---|---|---|---|---|---|
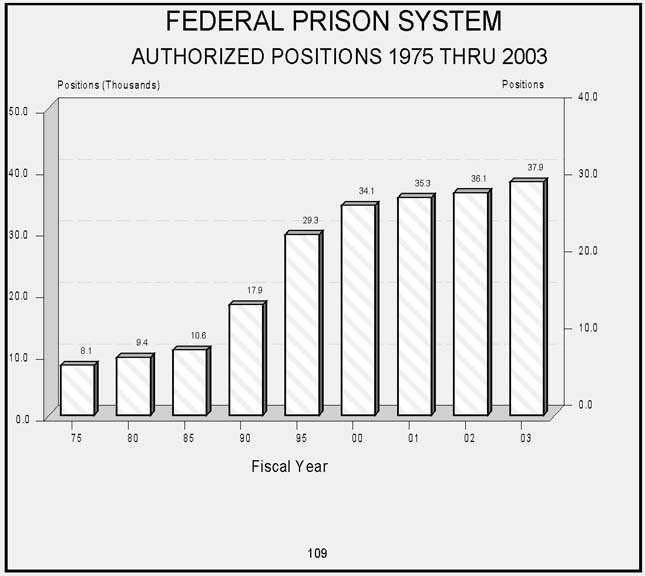
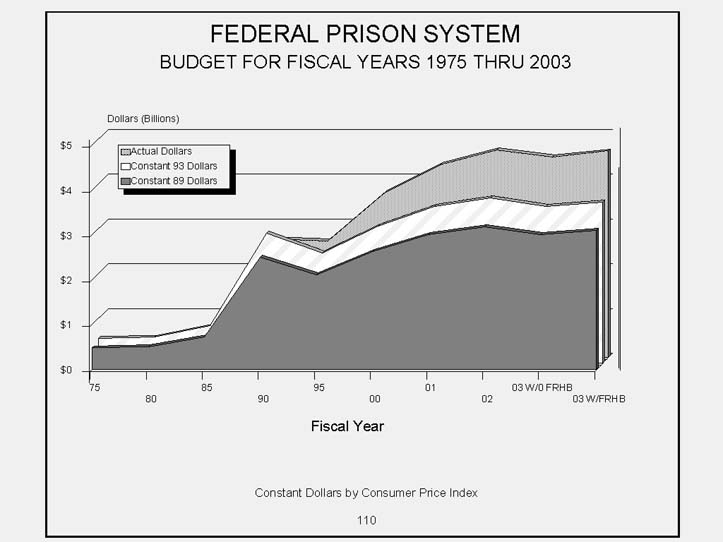
| 1975 | 8,068 | 208.3 | 37.4 | 556.9 | -73.9 | -90.2 | |||||||
| 1976 | 8,135 | 227.0 | 39.6 | 573.8 | -73.1 | -89.4 | |||||||
| 1977 | 8,296 | 325.7 | 42.1 | 773.4 | -63.7 | -84.7 | |||||||
| 1978 | 8,706 | 318.3 | 45.3 | 702.1 | -67.1 | -85.1 | |||||||
| 1979 | 9,445 | 348.7 | 50.4 | 691.3 | -67.6 | -83.6 | |||||||
| 1980 | 9,378 | 333.2 | 57.3 | 581.9 | -72.7 | -84.4 | |||||||
| 1981 | 9,225 | 361.8 | 63.2 | 572.4 | -73.2 | -83.0 | |||||||
| 1982 | 9,015 | 436.4 | 67.1 | 650.6 | -69.5 | -79.5 | |||||||
| 1983 | 9,145 | 496.9 | 69.2 | 717.7 | -66.3 | -76.7 | |||||||
| 1984 | 9,606 | 512.6 | 72.2 | 710.1 | -66.7 | -76.0 | |||||||
| 1985 | 10,557 | 623.0 | 74.8 | 833.3 | -60.9 | -70.8 | |||||||
| 1986 | 10,974 | 605.6 | 76.2 | 794.8 | -62.7 | -71.6 | |||||||
| 1987 | 11,382 | 876.2 | 79.0 | 1,109.4 | -48.0 | -58.9 | |||||||
| 1988 | @ | 11,938 | 1,069.1 | 82.1 | 1,301.5 | -39.0 | -49.9 | ||||||
| 1989 | # | 15,462 | 1,542.4 | 85.9 | 1,795.1 | -15.8 | -27.7 | ||||||
| 1990 | $ | 17,896 | 2,650.7 | 91.2 | 2,907.7 | 36.3 | 24.3 | ||||||
| 1991 | 22,531 | 1,738.0 | 94.5 | 1,838.5 | -13.8 | -18.5 | |||||||
| 1992 | 23,874 | 2,111.2 | 97.4 | 2,168.2 | 1.7 | -1.0 | |||||||
| 1993 | & | 25,375 | 2,132.7 | 100.0 | 2,132.7 | 0.0 | 0.0 | ||||||
| 1994 | 26,232 | 2,232.1 | 103.0 | 2,167.1 | 1.6 | 4.7 | |||||||
| 1995 | 29,312 | 2,596.0 | 105.6 | 2,458.9 | 15.3 | 21.7 | |||||||
| 1996 | V T | 30,779 | 2,881.6 | 108.7 | 2,650.0 | 24.3 | 35.1 | ||||||
| 1997 | V U | 33,141 | 3,183.6 | 111.1 | 2,864.7 | 34.3 | 49.3 | ||||||
| 1998 | V W | 32,801 | 3,097.3 | 112.8 | 2,745.8 | 28.7 | 45.2 | ||||||
| 1999 | V Y | 32,683 | 3,299.9 | 115.7 | 2,851.3 | 33.7 | 54.7 | ||||||
| 2000 | V Z R | 34,052 | 3,667.4 | 119.8 | 3,061.6 | 43.6 | 72.0 | ||||||
| 2001 | R | 35,341 | 4,303.5 | 122.9 | 3,501.6 | 64.2 | 101.8 | ||||||
| 2002 | 36,129 | 4,622.2 | 125.1 | 3,694.5 | 73.2 | 116.7 | |||||||
| 2003 W/O FRHB | 37,868 | 4,477.0 | 127.9 | 3,501.4 | 64.2 | 109.9 | |||||||
| 2003 W/ FRHB | 37,868 | 4,605.1 | 127.9 | 3,600.5 | 68.8 | 115.9 | |||||||
| FEDERAL PRISON SYSTEM BUDGET 1975 - 2003 |
|||||||||||||
| FISCAL YEAR | POSITIONS | FPS BUDGET (Millions) |
CPI INDEXED TO 1989 |
FPS BUDGET IN 1989 $ (Millions) |
FPS BUDGET REAL PERCENT GROWTH FROM 1989 |
FPS BUDGET APPARENT PERCENT GROWTH FROM 1989 |
|||||||
|---|---|---|---|---|---|---|---|---|---|---|---|---|---|
| 1975 | 8,068 | 208.3 | 43.5 | 478.5 | -69.0 | -86.5 | |||||||
| 1976 | 8,135 | 227.0 | 46.0 | 493.0 | -68.0 | -85.3 | |||||||
| 1977 | 8,296 | 325.7 | 49.0 | 664.5 | -56.9 | -78.9 | |||||||
| 1978 | 8,706 | 318.3 | 52.8 | 603.2 | -60.9 | -79.4 | |||||||
| 1979 | 9,445 | 348.7 | 58.7 | 593.9 | -61.5 | -77.4 | |||||||
| 1980 | 9,378 | 333.2 | 66.6 | 499.9 | -67.6 | -78.4 | |||||||
| 1981 | 9,225 | 361.8 | 73.6 | 491.8 | -68.1 | -76.5 | |||||||
| 1982 | 9,015 | 436.4 | 78.1 | 559.0 | -63.8 | -71.7 | |||||||
| 1983 | 9,145 | 496.9 | 80.6 | 616.6 | -60.0 | -67.8 | |||||||
| 1984 | 9,606 | 512.6 | 84.0 | 610.1 | -60.4 | -66.8 | |||||||
| 1985 | 10,557 | 623.0 | 87.0 | 716.0 | -53.6 | -59.6 | |||||||
| 1986 | 10,974 | 605.6 | 88.7 | 682.9 | -55.7 | -60.7 | |||||||
| 1987 | 11,382 | 876.2 | 91.9 | 953.2 | -38.2 | -43.2 | |||||||
| 1988 | @ | 11,938 | 1,069.1 | 95.6 | 1,118.3 | -27.5 | -30.7 | ||||||
| 1989 | # | 15,462 | 1,542.4 | 100.0 | 1,542.4 | 0.0 | 0.0 | ||||||
| 1990 | $ | 17,896 | 2,650.7 | 106.1 | 2,498.3 | 62.0 | 71.9 | ||||||
| 1991 | 22,531 | 1,738.0 | 110.0 | 1,579.6 | 2.4 | 12.7 | |||||||
| 1992 | 23,874 | 2,111.2 | 113.3 | 1,862.9 | 20.8 | 36.9 | |||||||
| 1993 | & | 25,375 | 2,132.7 | 116.4 | 1,832.4 | 18.8 | 38.3 | ||||||
| 1994 | 26,232 | 2,232.1 | 119.9 | 1,862.0 | 20.7 | 44.7 | |||||||
| 1995 | 29,312 | 2,596.0 | 122.9 | 2,112.7 | 37.0 | 68.3 | |||||||
| 1996 | V T | 30,779 | 2,881.6 | 126.6 | 2,276.9 | 47.6 | 86.8 | ||||||
| 1997 | V U | 33,141 | 3,183.6 | 129.3 | 2,461.3 | 59.6 | 106.4 | ||||||
| 1998 | V W | 32,801 | 3,097.3 | 131.3 | 2,359.2 | 53.0 | 100.8 | ||||||
| 1999 | V Y | 32,683 | 3,299.9 | 134.7 | 2,449.8 | 58.8 | 113.9 | ||||||
| 2000 | V Z R | 34,052 | 3,667.4 | 139.4 | 2,630.6 | 70.6 | 137.8 | ||||||
| 2001 | R | 35,341 | 4,303.5 | 143.0 | 3,008.6 | 95.1 | 179.0 | ||||||
| 2002 | 36,129 | 4,622.2 | 145.6 | 3,174.3 | 105.8 | 199.7 | |||||||
| 2003 W/O FRHB | 37,868 | 4,477.0 | 148.8 | 3,008.4 | 95.0 | 190.3 | |||||||
| 2003 W/ FRHB | 37,868 | 4,605.1 | 148.8 | 3,094.8 | 100.6 | 198.6 | |||||||