


Automotive Fuel
Economy Program
This publication is distributed by the United States Department of Transportation, National Highway Traffic Safety Administration, in the interest of information exchange. The opinions, findings, and conclusions expressed in this publication are those of the author(s) and not necessarily those of the Department of Transportation or the National Highway Traffic Safety Administration. The United States Government assumes no liability for its contents or use thereof. If trade or manufacturers' name or products are mentioned, it is because they are considered essential to the object of the publication and should not be construed as an endorsement. The United States Government does not endorse products or manufacturers.
AUTOMOTIVE FUEL ECONOMY PROGRAM
TABLE OF CONTENTS
SECTION I: INTRODUCTION
SECTION II: FUEL ECONOMY IMPROVEMENT BY MANUFACTURERS
SECTION I: INTRODUCTION
The Twenty-second Annual Report to Congress on the Automotive Fuel Economy Program summarizes the activities of the National Highway Traffic Safety Administration (NHTSA) during 1997, in accordance with 49 U.S.C. 32916 et seq., which requires the submission of a report each year. Included in this report is a section summarizing rulemaking activities during 1997.
The Secretary of Transportation is required to administer a program for regulating the fuel economy of new passenger cars and light trucks in the United States market. The authority to administer the program was delegated by the Secretary to the Administrator of NHTSA, 49 C.F.R. 1.50(f).
NHTSA's responsibilities in the fuel economy area include:
(1) establishing and amending average fuel economy standards for manufacturers of passenger cars and light trucks, as necessary;
(2) promulgating regulations concerning procedures, definitions, and reports necessary to support the fuel economy standards;
(3) considering petitions for exemption from established fuel economy standards by low volume manufacturers (those producing fewer than 10,000 passenger cars annually worldwide) and establishing alternative standards for them;
(4) preparing reports to Congress annually on the fuel economy program;
(5) enforcing fuel economy standards and regulations; and
(6) responding to petitions concerning domestic production by foreign manufacturers, and other matters.
Passenger car fuel economy standards were established by Congress for Model Year (MY) 1985 and thereafter at a level of 27.5 miles per gallon (mpg). NHTSA is authorized to amend the standard above or below that level. Standards for light trucks were established by NHTSA for MYs 1979 through 1999. NHTSA set a combined standard of 20.7 mpg for light truck fleets for MY 1999. All current standards are listed in Table I-1.
| Table I-1 | ||||
|---|---|---|---|---|
| Fuel Economy Standards for Passenger Cars and Light Trucks Model Years 1978 through 1999 (in MPG) |
||||
| Model Year | Passenger Cars | Light Trucks (1) | ||
| Two-wheel Drive | Four-wheel Drive | Combined(2), (3) | ||
| 1978 | 18.0(4) | ... | ... | ... |
| 1979 | 19.0(4) | 17.2 | 15.8 | ... |
| 1980 | 20.0(4) | 16.0 | 14.0 | ...(5) |
| 1981 | 22.0 | 16.7(6) | 15.0 | ...(5) |
| 1982 | 24.0 | 18.0 | 16.0 | 17.5 |
| 1983 | 26.0 | 19.5 | 17.5 | 19.0 |
| 1984 | 27.0 | 20.3 | 18.5 | 20.0 |
| 1985 | 27.5(4) | 19.7(7) | 18.9(7) | 19.5(7) |
| 1986 | 26.0(8) | 20.5 | 19.5 | 20.0 |
| 1987 | 26.0(9) | 21.0 | 19.5 | 20.5 |
| 1988 | 26.0(9) | 21.0 | 19.5 | 20.5 |
| 1989 | 26.5(10) | 21.5 | 19.0 | 20.5 |
| 1990 | 27.5(4) | 20.5 | 19.0 | 20.0 |
| 1991 | 27.5(4) | 20.7 | 19.1 | 20.2 |
| 1992 | 27.5(4) | ... | ... | 20.2 |
| 1993 | 27.5(4) | ... | ... | 20.4 |
| 1994 | 27.5(4) | ... | ... | 20.5 |
| 1995 | 27.5(4) | ... | ... | 20.6 |
| 1996 | 27.5(4) | ... | ... | 20.7 |
| 1997 | 27.5(4) | ... | ... | 20.7 |
| 1998 | 27.5(4) | ... | ... | 20.7 |
| 1999 | 27.5(4) | ... | ... | 20.7 |
SECTION II: FUEL ECONOMY IMPROVEMENT BY MANUFACTURERS
A. Fuel Economy Performance by Manufacturer
The fuel economy achievements for domestic and foreign-based manufacturers in MY 1996 were updated to consider final production figures, where available, since the publication of the Twenty-first Annual Report to the Congress. These fuel economy achievements and current projected data for MY 1997 are listed in Tables II-1 and II-2.
Overall fleet fuel economy for passenger cars was 28.6 mpg in MY 1997, a decrease of 0.1 mpg from the MY 1996 level. For MY 1997, Corporate Average Fuel Economy (CAFE) values increased above MY 1996 levels for ten of 24 passenger car manufacturers' fleets. (See Table II-1.) These ten companies accounted for more than 39 percent of the total MY 1997 production. Manufacturers continued to introduce new technologies and more fuel-efficient models, and some larger, less fuel-efficient models. For MY 1997, the overall domestic manufacturers' fleet average fuel economy was 27.9 mpg. For MY 1997, Ford, Mazda, and Toyota domestic passenger car CAFE values rose 0.3 mpg, 0.5 mpg, and 0.5 mpg from their 1996 levels, while Chrysler, General Motors, and Honda fell 0.1 mpg, 0.1 mpg, and 3.3 mpg, respectively, from their MY 1996 levels. Overall, the domestic manufacturers' combined CAFE decreased 0.4 mpg below MY 1996 level.
| Table II-1 | ||
|---|---|---|
| PASSENGER CAR FUEL ECONOMY PERFORMANCE BY MANUFACTURER* MODEL YEARS 1996 AND 1997 |
||
| MANUFACTURER | MODEL YEAR CAFE (MPG) | |
| 1996 | 1997 | |
| DOMESTIC | ||
| Chrysler | 27.6 | 27.5 |
| Ford | 26.8 | 27.1 |
| General Motors | 28.3 | 28.2 |
| Honda | 33.2 | 29.9 |
| Mazda | 29.8 | 30.3 |
| Toyota | 28.3 | 28.8 |
| Sales Weighted Average (Domestic) | 28.3 | 27.9 |
| IMPORT | ||
| BMW | 27.3 | 25.7 |
| Chrysler Imports | 28.2 | 26.4 |
| Fiat | 13.8 | 13.5 |
| Ford Imports | 31.5 | 30.9 |
| GM Imports | 35.8 | 31.3 |
| Honda | 27.8 | 34.4 |
| Hyundai | 32.9 | 30.9 |
| Kia | 29.0 | 30.6 |
| Mazda | 32.7 | 31.3 |
| Mercedes-Benz | 25.1 | 24.9 |
| Mitsubishi | 29.9 | 30.0 |
| Nissan | 30.4 | 29.9 |
| Porsche | 21.5 | 22.0 |
| Subaru | 27.7 | 28.0 |
| Suzuki | 34.0 | 33.9 |
| Toyota | 29.8 | 30.2 |
| Volvo | 26.1 | 25.8 |
| Volkswagen | 28.2 | 28.6 |
| Sales Weighted Average (Import) | 29.7 | 29.8 |
| TOTAL FLEET AVERAGE | 28.7 | 28.6 |
| FUEL ECONOMY STANDARDS | 27.5 | 27.5 |
| Table II-2 | ||
| LIGHT TRUCK FUEL ECONOMY PERFORMANCE BY MANUFACTURER MODEL YEARS 1996 AND 1997 |
||
|---|---|---|
| MANUFACTURER | MODEL YEAR CAFE (MPG) Combined |
|
| 1996 | 1997 | |
| DOMESTIC | ||
| Chrysler | 20.3 | 20.2 |
| Ford | 20.6 | 20.0 |
| General Motors | 20.7 | 20.2 |
| Sales Weighted Average (Domestic) | 20.5 | 20.1 |
| IMPORT | ||
| Honda | * | 27.1 |
| Isuzu | 19.5 | 19.4 |
| Kia | 23.4 | 23.8 |
| Land Rover | 17.2 | 17.2 |
| Mazda | 21.2 | 20.5 |
| Mitsubishi | 19.1 | 22.3 |
| Nissan | 23.0 | 22.1 |
| Suzuki | 27.5 | 27.4 |
| Toyota | 23.2 | 22.6 |
| Volkswagen | * | 18.5 |
| Sales Weighted Average (Import) | 22.1 | 22.1 |
| TOTAL FLEET AVERAGE | 20.7 | 20.4 |
| FUEL ECONOMY STANDARDS | 20.7 | 20.7 |
In MY 1997, the fleet average fuel economy for import passenger cars increased by 0.1 mpg from the MY 1996 CAFE level to 29.8 mpg. Seven of the 18 import car manufacturers increased their CAFE values between MYs 1996 and 1997. Figure II-1 illustrates the changes in total new passenger car fleet CAFE from MY 1978 to MY 1997.
The total light truck fleet CAFE decreased 0.3 mpg below the MY 1996 CAFE level of 20.7 mpg (see Table II-2). Figure II-2 illustrates the trends in total light truck fleet CAFE from MY 1979 to MY 1997.
Several passenger car and light truck manufacturers are projected to fail to achieve the levels of the MY 1997 CAFE standards. However, NHTSA is not yet able to determine which of these manufacturers may be liable for civil penalties for non-compliance. Some MY 1997 CAFE values may change when final figures are provided to NHTSA by EPA, in mid-1998. In addition, several manufacturers are not expected to pay civil penalties because the credits they earned by exceeding the fuel economy standards in earlier years offset later shortfalls. Other manufacturers may file carryback plans to demonstrate that they anticipate earning credits in future model years to offset current deficits.

B. Characteristics of the MY 1997 Passenger Car Fleet
The characteristics of the MY 1997 passenger car fleet reflect a continuing trend toward satisfying consumer demand for higher performance cars. (See Table II-3.) From MY 1996 to MY 1997, horsepower/100 pounds, a measure of vehicle performance, increased from 5.00 to 5.02 for domestic passenger cars and from 4.76 to 4.82 for import passenger cars. The total fleet average for passenger cars increased from 4.93 horsepower/100 pounds in MY 1996 to 4.95 in MY 1997. Compared with MY 1996, the average curb weight for MY 1997 increased by 32 pounds for the domestic fleet and 39 pounds for the import fleet. The total new passenger car fleet average weight increased from 3,049 pounds in MY 1996 to 3,071 pounds in MY 1997. Average engine displacement increased from 178 to 180 cubic inches for domestic passenger cars and from 134 to 135 cubic inches for import passenger cars, from MY 1996 to MY 1997.
The 0.4 mpg fuel economy decline for the MY 1997 domestic passenger car fleet may be attributed in part to an increase in average weight, mix shifts, and an increase in the use of automatic transmissions.
The size/class breakdown shows an increased trend primarily toward subcompact and mid-size passenger cars with the reduction of compact passenger cars for the overall fleet. The size/class mix in the domestic fleet shifted from compact passenger cars to subcompact, mid-size, and large passenger cars. The size/class mix in the import fleet shifted from compact and mid-size passenger cars to two-seater, minicompact, subcompact, and large passenger cars. The import share of the passenger car market increased by 6.4 percentage points in MY 1997.
Table II-3
*Includes associated station wagons.
PASSENGER CAR FLEET CHARACTERISTICS FOR MYs 1996 AND 1997
TOTAL FLEET
DOMESTIC
FLEETIMPORT
FLEET
CHARACTERISTICS
1996
1997
1996
1997
1996
1997
Fleet Average Fuel Economy, mpg
28.7
28.6
28.3
27.9
29.7
29.8
Fleet Average Curb Weight, lbs.
3049
3071
3111
3143
2905
2944
Fleet Average Engine Displacement, cu. in.
165
164
178
180
134
135
Fleet Average Horsepower/Weight ratio, HP/100 lbs.
4.93
4.95
5.00
5.02
4.76
4.82
% of Fleet
100
100
70.0
63.6
30.0
36.4
Segmentation by EPA Size Class, %
Two-Seater
0.9
1.0
0.5
0.3
2.0
2.3
Minicompact
0.4
0.6
0.0
0.0
1.5
1.6
Subcompact*
11.0
17.6
6.4
7.2
21.6
35.9
Compact*
44.7
37.4
44.7
39.3
44.5
33.9
Mid-Size*
29.6
30.3
29.7
33.3
29.5
25.2
Large*
13.4
13.1
18.7
19.9
0.9
1.2
Diesel Engines
0.10
0.08
0.0
0.0
0.3
0.2
Turbo or Supercharged Engines
1.1
1.5
0.5
1.3
2.3
1.8
Fuel Injection
100
100
100
100
100
100
Front-Wheel Drive
86.0
85.8
86.9
87.8
84.1
82.2
Automatic Transmissions
84.7
86.1
88.5
91.4
76.1
77.0
Automatic Transmissions with Lockup Clutches
97.9
97.7
100
100
92.1
93.1
Automatic Transmissions with Four or more Forward Speeds
88.8
92.1
89.0
90.6
88.1
95.2
The domestic fleet rose above its MY 1996 level in the share of turbocharged and supercharged engines, while there was a reduction in such engines in the import fleet. Diesel engine shares decreased slightly in MY 1997, and diesels were offered by two manufacturers, Mercedes-Benz and Volkswagen.
Passenger car fleet average characteristics have changed significantly since MY 1978 (the first year of fuel economy standards). (See Table II-4.) After substantial initial weight loss (from MY 1978 to MY 1982, the average passenger car fleet curb weight decreased from 3,349 to 2,808 pounds), the curb weight has increased in 9 of the past 10 model years, reaching 3,071 lbs in MY 1997. This is the highest value of any year since MY 1979. Table II-4 shows that the MY 1997 passenger car fleet has nearly equal interior volume and higher performance, but with more than 43 percent better fuel economy, than the MY 1978 fleet. (See Figure II-3.)
C. Characteristics of the MY 1997 Light Truck Fleet
The characteristics of the MY 1997 light truck fleet are shown in Table II-5. Light truck manufacturers are not required to divide their fleets into domestic and import fleets based on the 75-percent domestic content threshold used for passenger car fleets. The light truck fleet is categorized according to two-wheel drive or four-wheel drive.
| Table II-4 | |||||
| New Passenger Car Fleet Average Characteristics Model Years 1978-1997 |
|||||
|---|---|---|---|---|---|
| Model Year |
Fuel Economy (mpg) |
Curb Weight (lb.) |
Interior Space (cu. ft.) |
Engine Size (cu. in.) |
Horsepower/ Weight (hp/100 lb.) |
| 1978 | 19.9 | 3349 | 112 | 260 | 3.68 |
| 1979 | 20.3 | 3180 | 110 | 238 | 3.72 |
| 1980 | 24.3 | 2867 | 105 | 187 | 3.51 |
| 1981 | 25.9 | 2883 | 108 | 182 | 3.43 |
| 1982 | 26.6 | 2808 | 107 | 173 | 3.47 |
| 1983 | 26.4 | 2908 | 109 | 182 | 3.57 |
| 1984 | 26.9 | 2878 | 108 | 178 | 3.66 |
| 1985 | 27.6 | 2867 | 108 | 177 | 3.84 |
| 1986 | 28.2 | 2821 | 106 | 169 | 3.89 |
| 1987 | 28.5 | 2805 | 109 | 162 | 3.98 |
| 1988 | 28.8 | 2831 | 108 | 161 | 4.11 |
| 1989 | 28.4 | 2879 | 109 | 163 | 4.28 |
| 1990 | 28.0 | 2906 | 108 | 163 | 4.53 |
| 1991 | 28.4 | 2934 | 108 | 164 | 4.42 |
| 1992 | 27.9 | 3007 | 108 | 169 | 4.56 |
| 1993 | 28.4 | 2971 | 109 | 164 | 4.62 |
| 1994 | 28.3 | 3011 | 109 | 169 | 4.79 |
| 1995 | 28.6 | 3047 | 109 | 166 | 4.87 |
| 1996 | 28.7 | 3049 | 109 | 165 | 4.93 |
| 1997 | 28.6 | 3071 | 109 | 164 | 4.95 |

Table II-5
| LIGHT TRUCK FLEET CHARACTERISTICS FOR MYs 1996 AND 1997 | ||||||
|---|---|---|---|---|---|---|
| TOTAL FLEET | Two-wheel Drive |
Four-wheel Drive |
||||
| CHARACTERISTICS | 1996 | 1997 | 1996 | 1997 | 1996 | 1997 |
| Fleet Average Fuel Economy, mpg | 20.7 | 20.4 | 21.9 | 21.7 | 19.3 | 19.0 |
| Fleet Average Equivalent Test Weight, lbs. | 4351 | 4471 | 4195 | 4283 | 4602 | 4703 |
| Fleet Average Engine Displacement, cu. in. | 244 | 249 | 230 | 235 | 266 | 266 |
| Fleet Average Horsepower/ Weight ratio, HP/100 lbs. | 4.07 | 4.20 | 3.99 | 4.18 | 4.20 | 4.23 |
| % of Fleet | 100 | 100 | 61.7 | 55.3 | 38.3 | 44.7 |
| % of Fleet from Foreign-based Manufacturers | 12.1 | 14.2 | 8.7 | 9.6 | 17.7 | 19.8 |
| Segmentation by Type, % | ||||||
| Passenger Van | 22.6 | 16.4 | 35.4 | 28.1 | 1.3 | 1.9 |
| Cargo Van | 3.8 | 3.9 | 6.0 | 6.9 | 0.2 | 0.3 |
| Small Pickup | ||||||
| 7.2 | 6.0 | 11.7 | 10.8 | ---- | ---- | |
| ---- | ---- | ---- | ---- | ---- | ---- | |
| Large Pickup | ||||||
| 19.2 | 20.8 | 31.5 | 37.6 | ---- | ---- | |
| 10.9 | 14.8 | ---- | ---- | 28.5 | 33.1 | |
| Special Purpose | ||||||
| 9.4 | 9.2 | 15.3 | 16.6 | ---- | ---- | |
| 26.8 | 28.9 | ---- | ---- | 70.0 | 64.7 | |
| Diesel Engines | 0.07 | 0.03 | 0.04 | 0.01 | 0.12 | 0.04 | Turbo/Supercharged Engines | 0.07 | 0.11 | 0.04 | 0.13 | 0.12 | 0.10 |
| Fuel Injection | 100 | 100 | 100 | 100 | 100 | 100 |
| Automatic Transmissions | 84.2 | 85.1 | 81.9 | 83.1 | 87.9 | 87.7 |
| Automatic Transmissions with Lockup Clutches | 98.9 | 99.5 | 98.1 | 99.1 | 100 | 100 |
| Automatic Transmissions with Four or More Forward Speeds | 93.8 | 95.1 | 89.7 | 92.2 | 99.4 | 98.5 |
The MY 1997 average test weight of the total light truck fleet increased by 120 pounds over that for MY 1996. The average fuel economy of the fleet decreased by 0.3 mpg to 20.4 mpg. Diesel engine usage decreased in light trucks to 0.03 percent in MY 1997 from 0.07 percent in MY 1996. The four-wheel drive share of the MY 1997 fleet increased by 6.4 percentage points over that for the MY 1996 level of 38.3 percent.
CAFE levels for light trucks in the 0-8,500 pounds gross vehicle weight (GVW) class increased from 18.5 mpg in MY 1980 to 21.7 mpg in MY 1987, before declining to 20.4 mpg in MY 1997, influenced by an increase in average weight, engine size, and performance. Light truck production increased from 1.9 million in MY 1980 to 6.1 million in MY 1997. Light trucks comprised 43 percent of the total light duty vehicle fleet production in MY 1997, 2.5 times the share in MY 1980.
D. Passenger Car and Light Truck Fleet Economy Averages
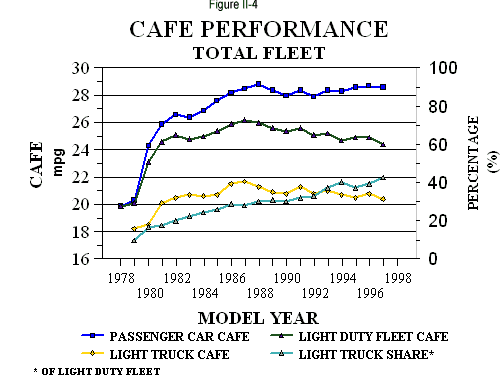
Figure II-4 illustrates an increase in the light duty fleet (combined passenger cars and light trucks) average fuel economy through MY 1987, followed by a gradual decline. (See also Table II-6.) Passenger car average fuel economy remained relatively constant for MYs 1987-1997. The overall decline in fuel economy illustrates the growing influence of light trucks and their significant impact on the light duty fleet.
Both passenger car and light truck fleet fuel economies decreased from MY 1996 to MY 1997 by 0.1 mpg and 0.3 mpg, respectively, contributing to the decline of the total fleet fuel economy for MY 1997 to 24.4 mpg. The shift to light trucks for general transportation is an important trend in consumers' preference and has a significant fleet fuel consumption effect.
E. Domestic and Import Fleet Fuel Economy Averages
Domestic and import passenger car fleet average fuel economies have improved since MY 1978, although the increase is far more dramatic for the domestic fleet. In MY 1997, the domestic passenger car fleet average fuel economy decreased from the MY 1996 level to 27.9 mpg. Import passenger car fleet average fuel economy increased slightly from MY 1996 to 29.8 mpg. Compared with MY 1978, this reflects an increase of 9.2 mpg for domestic cars and 2.5 mpg for import cars.
Since MY 1980, the total light truck fleet average fuel economy and the average for domestic light truck manufacturers have improved overall, but both have remained below the fuel economy level for the import light truck fleet. The import light truck average fuel economy has decreased significantly since its highest level of 27.4 mpg for MY 1981 to 22.1 mpg for MY 1997. For MY 1997, the domestic light truck fleet has an average fuel economy level of 20.1 mpg, which is 2.0 mpg lower than the import light truck fleet. For MY 1997, the import light truck fleet fuel economy remains at the MY 1996 level of 22.1 mpg. The domestic manufacturers continued to dominate the light truck market, comprising 85 percent of the total light truck fleet.
| DOMESTIC AND IMPORT PASSENGER CAR AND LIGHT TRUCK FUEL ECONOMY AVERAGES FOR MODEL YEARS 1978-1997 (in MPG) |
||||||||||
|---|---|---|---|---|---|---|---|---|---|---|
| Model Year |
Domestic | Import | All Cars | All Light Trucks |
Total Fleet |
Light Truck Share of Fleet (%) |
||||
| Car | Light Truck |
Combined | Car | Light Truck* |
Combined | |||||
| 1978 | 18.7 | ... | ... | 27.3 | ... | ... | 19.9 | ... | ... | ... |
| 1979 | 19.3 | 17.7 | 19.1 | 26.1 | 20.8 | 25.5 | 20.3 | 18.2 | 20.1 | 9.8 |
| 1980 | 22.6 | 16.8 | 21.4 | 29.6 | 24.3 | 28.6 | 24.3 | 18.5 | 23.1 | 16.7 |
| 1981 | 24.2 | 18.3 | 22.9 | 31.5 | 27.4 | 30.7 | 25.9 | 20.1 | 24.6 | 17.6 |
| 1982 | 25.0 | 19.2 | 23.5 | 31.1 | 27.0 | 30.4 | 26.6 | 20.5 | 25.1 | 20.1 |
| 1983 | 24.4 | 19.6 | 23.0 | 32.4 | 27.1 | 31.5 | 26.4 | 20.7 | 24.8 | 22.5 |
| 1984 | 25.5 | 19.3 | 23.6 | 32.0 | 26.7 | 30.6 | 26.9 | 20.6 | 25.0 | 24.4 |
| 1985 | 26.3 | 19.6 | 24.0 | 31.5 | 26.5 | 30.3 | 27.6 | 20.7 | 25.4 | 25.9 |
| 1986 | 26.9 | 20.0 | 24.4 | 31.6 | 25.9 | 29.8 | 28.2 | 21.5 | 25.9 | 28.6 |
| 1987 | 27.0 | 20.5 | 24.6 | 31.2 | 25.2 | 29.6 | 28.5 | 21.7 | 26.2 | 28.1 |
| 1988 | 27.4 | 20.6 | 24.5 | 31.5 | 24.6 | 30.0 | 28.8 | 21.3 | 26.0 | 30.1 |
| 1989 | 27.2 | 20.4 | 24.2 | 30.8 | 23.5 | 29.2 | 28.4 | 20.9 | 25.6 | 30.8 |
| 1990 | 26.9 | 20.3 | 23.9 | 29.9 | 23.0 | 28.5 | 28.0 | 20.8 | 25.4 | 30.1 |
| 1991 | 27.3 | 20.9 | 24.4 | 30.1 | 23.0 | 28.4 | 28.4 | 21.3 | 25.6 | 32.2 |
| 1992 | 27.0 | 20.5 | 23.8 | 29.2 | 22.7 | 27.9 | 27.9 | 20.8 | 25.1 | 32.9 |
| 1993 | 27.8 | 20.7 | 24.2 | 29.6 | 22.8 | 28.1 | 28.4 | 21.0 | 25.2 | 37.4 |
| 1994 | 27.5 | 20.5 | 23.5 | 29.6 | 22.0 | 27.7 | 28.3 | 20.7 | 24.7 | 40.2 |
| 1995 | 27.7 | 20.3 | 23.8 | 30.3 | 21.5 | 27.9 | 28.6 | 20.5 | 24.9 | 37.4 |
| 1996 | 28.3 | 20.5 | 24.1 | 29.7 | 22.1 | 27.7 | 28.7 | 20.8 | 24.9 | 39.4 |
| 1997 | 27.9 | 20.1 | 23.4 | 29.8 | 22.1 | 27.5 | 28.6 | 20.4 | 24.4 | 42.8 |
The disparity between the average CAFEs of the import and domestic manufacturers has declined in recent years as domestic manufacturers have maintained relatively stable CAFE values while the import manufacturers moved to larger vehicles, and more four-wheel drive light trucks, thus lowering their CAFE values.
A. Light Truck CAFE Standards
On April 3, 1997, NHTSA published a final rule establishing a combined standard of 20.7 mpg for light trucks for MY 1999. The Department of Transportation and Related Agencies Appropriations Act for Fiscal Year 1997, Pub. L. 104-205, precludes the agency from setting the MY 1999 standard at a level other than the level for MY 1998.
B. Low Volume Petitions
49 U.S.C. 32902(d) provides that a low volume manufacturer of passenger cars may be exempted from the generally applicable passenger car fuel economy standards if these standards are more stringent than the maximum feasible average fuel economy for that manufacturer and if NHTSA establishes an alternative standard for that manufacturer at its maximum feasible level. A low volume manufacturer is one that manufactured fewer than 10,000 passenger cars worldwide, in the model year for which the exemption is sought (the affected model year) and in the second model year preceding that model year.
In 1997, NHTSA acted on three low volume petitions that were filed by Lotus, Rolls-Royce, and the Coalition of Small Volume Automobile Manufacturers, Inc. (COSVAM).
Lotus submitted to the agency its low volume petition for MYs 1994, 1995, 1997, and 1998. NHTSA issued a final decision to grant alternative standards of 24.2 mpg for MY 1994 and 23.3 mpg for MY 1995 and denied requests for MYs 1997 and 1998 (62 FR 37153, July 11, 1997).
In October 1996, Perusahaan Otomobil Nasional Berhad (Proton) acquired controlling interest in Lotus Cars Ltd. That acquisition rendered Lotus ineligible under 49 U.S.C. section 32902(d) for exemption for MYs 1997 and 1998 because Proton has an annual worldwide production of more than 10,000 vehicles.
Rolls-Royce requested alternative standards for its passenger cars for MYs 1998 and 1999. NHTSA issued a final decision to grant an alternative standard of 16.3 mpg for MYs 1998 and 1999 (62 FR 17100, April 9, 1997).
The Coalition of Small Volume Automobile Manufacturers, Inc. (COSVAM) submitted a petition to amend 49 Part 525.5 (limitation on eligibility for exemptions from average fuel economy standards). COSVAM requested that the agency not count the production of parent firms when low volume producers apply for low volume exemption. Members of COSVAM include Rolls-Royce, Ferrari, AM General, Aston Martin, Callaway, CSI Laboratories, de Tomaso, Lamborghini, Lotus, Maserati, McLaren, Morgan, and TWR Engineering. Several members of COSVAM are subsidiaries of larger vehicle manufacturers. For example, Ferrari and Aston Martin produce fewer than 10,000 passenger cars worldwide annually but are owned by Fiat S.p.A. and Ford Motor Company, respectively. Ferrari and Aston Martin are ineligible for CAFE exemption because of their ownership by Fiat and Ford. However, Rolls-Royce, an independent manufacturer, produces fewer than 10,000 passenger cars worldwide and is not owned by another automaker. It is eligible for exemption from the average fuel economy standards. The agency concluded that, for CAFE purposes "vehicles manufactured by a manufacturer" includes, all vehicles manufactured, worldwide, by any entity that controls, is controlled by, or is under common control with the manufacturer. The agency issued a denial of the petition to adopt COSVAM's definition that defined the number of "Passenger automobiles manufactured by a manufacturer" (62 FR 39207, July 22, 1997) because COSVAM's definition is contrary to the language and intent of the governing statute.
In calendar year 1996, the agency acted on a joint petition filed by Lamborghini and Vector that was not included in the previous Annual Report to Congress. NHTSA issued a final decision to grant alternative standards of 12.8 mpg for MY 1995, 12.6 mpg for MY 1996, and 12.5 mpg for MY 1997 (61 FR 67491, December 23, 1996).
C. Enforcement
49 U.S.C. 32912(b) imposes a civil penalty for each tenth of a mpg by which a manufacturer's CAFE level falls short of the standard, multiplied by the total number of passenger automobiles or light trucks produced by the manufacturer in that model year. Credits earned for exceeding the standard in any of the three model years immediately prior to or subsequent to the model years in question can be used to offset the penalty.
On March 6, 1997, the civil penalty for manufacturers that violate a fuel economy standard increased from $5.00 to $5.50 pursuant to the inflation adjustment methodology included in the Debt Collection Improvement Act of 1996 (62 FR 5167, February 4, 1997).
Table III-1 shows CAFE fines paid by manufacturers in calendar year 1997. In calendar year 1997, manufacturers paid civil penalties totaling $806,465 for failing to comply with the fuel economy standards of 27.5 mpg for passenger cars in MYs 1994 and 1995. Final CAFE values were not available for manufacturers that may owe fines for MY 1996.
| Table III-1 | |||
| CAFE FINES COLLECTED DURING CALENDAR YEAR 1997 | |||
|---|---|---|---|
| Model Year | Manufacturer | Amount Fined | Date Paid |
| 1994 | Panoz | $3,850 | 08/97 |
| 1995 | Fiat | 801,220 | 07/97 |
| Panoz | 1,395 | 08/97 | |
D. Carryback Plans
49 U.S.C. 32903 allows an automobile manufacturer to earn fuel economy credits during any model year in which the manufacturer's fleet exceeds the established CAFE standard. The amount of credits a manufacturer earns is determined by multiplying the number of tenths of a mile per gallon by which the average fuel economy of the manufacturer's fleet in the model year exceeds the standard by the total number of vehicles in the manufacturer's fleet for the model year.
Already earned fuel economy credits are carried forward by the agency, (with affected manufacturers given an opportunity to comment on the agency's allocation of credits) and distributed to any of the three succeeding model years in which the manufacturer's fleet falls below the CAFE standard. For example, credits earned in MY 1994 may be used to offset deficiencies in MYs 1995, 1996, and/or 1997. A manufacturer also may submit to the agency a carryback plan, which demonstrates that it will earn sufficient credits within the following three model years which can be allocated to offset penalties in the model year involved.
General Motors submitted a carryback plan dated August 18, 1997 to the agency for MYs 1994 and 1995 light truck CAFE compliance. General Motor's carryback plan was approved.
E. Contract Activities
During 1997, NHTSA continued to fund the maintenance of a database that details the products and production capacities of North American automobile manufacturing plants. The Volpe National Transportation Systems Center administers this program with annual funding of $60,000.
In calendar year 1996, NHTSA initiated a study with a consultant to evaluate the fuel economy effects and cost and leadtime impacts of variable valve timing engine technology. The report and an in-house study of retail costs was published in Spring 1997.
The agency awarded Dr. Donald Patterson a contract totaling $52,000 to study the fuel economy effects, cost, and leadtime impacts of variable valve timing engine technology. In May 1997, the study was concluded and final results were published in a report titled, Fuel Economy Effects and Incremental Cost, Weight and Lead Time Impacts of Employing Variable Valve Timing (VVT) Engine Technology (DOT Report Number: HS 808 594). The in-house cost study was published with the same title as DOT Report Number HS 808 589.
In recent years, new mechanical inventions and electronic engine controls have made variable valve timing (VVT) a production possibility. Variable valve timing can improve fuel economy by lowering idle speeds, allowing engine downsizing and improving cycle efficiency under part load operation (mainly by reducing pumping work).
The report presents a paper study of the fuel economy benefits and the incremental manufacturing costs, tooling costs and engine weights as well as production leadtime for a VVT engine. Emission levels are considered. As a base, a 4-valve, V-6 engine of 3.5 liters was used with a 3,750 pounds passenger car. The VVT system applied to that engine was a combination of the Atsugi cam phasing system, a modified Mitsubishi MIVEC long and short duration cam system and intake port throttle. Fuel economy calculations were made as well for a typical light truck of 3,625 pounds with a 3.0 liter engine.
The study suggests that the incorporation of VVT features into a modern V-6 engine will be costly to the vehicle buyer, at an estimated retail price increase of $392 (1997 dollars). Fuel economy gains will be significant over the life of the vehicle, estimated as up to 10.4 percent for a passenger car and up to 8.8 percent for a light truck.
The study presents these general findings of VVT: