A magnitude 6.6 earthquake struck a sparsely inhabited area of southeast
Iran on March 14, 1998, at 11:10 p.m. local time. There were three
previous large (magnitudes 5.9 to 7.1) earthquakes since 1981 in this
same area around the towns of Sirch, Fandoqa and Gowk. Scientists from
NASA's Jet Propulsion Laboratory, Pasadena, Calif., and the Centre for
Observation and Modelling of Earthquakes and Tectonics (University of
Oxford, UK and the University of Cambridge, UK) and Stanford University
used interferometric analysis of radar data from the European Remote
Sensing satellites and seismology to study the fault rupture of the 1998
earthquake. The interferometric analysis was performed with software
developed at JPL.
The surprising result from the radar interferometry was the discovery
that another fault, some 10 to 30 kilometers (6 to 19 miles) to the east
of the fault that ruptured in the 1998 earthquake, also moved during the
six months after the earthquake. This second fault to the east of the
1998 earthquake has been called the Shahdad thrust fault after the town
of Shahdad. The Shahdad thrust fault slip did not cause any detectable
seismic waves, but the large area affected and the amount of slip would
have been equivalent to a magnitude 6.0 earthquake if it had caused
seismic waves. Because there were no seismic waves caused by the slip on
the Shahdad thrust fault, it has been called "aseismic" or a "silent
earthquake." Calculations of the transfer of stress in the Earth indicate
that the March 1998 earthquake probably caused the slip on the Shahdad
fault, and that the additional stresses were released by the "silent"
slip. If other thrust faults like the Shahdad thrust in places like Los
Angeles manage to move silently (or "aseismically"), then they might
release stresses that would otherwise build up to cause earthquakes.
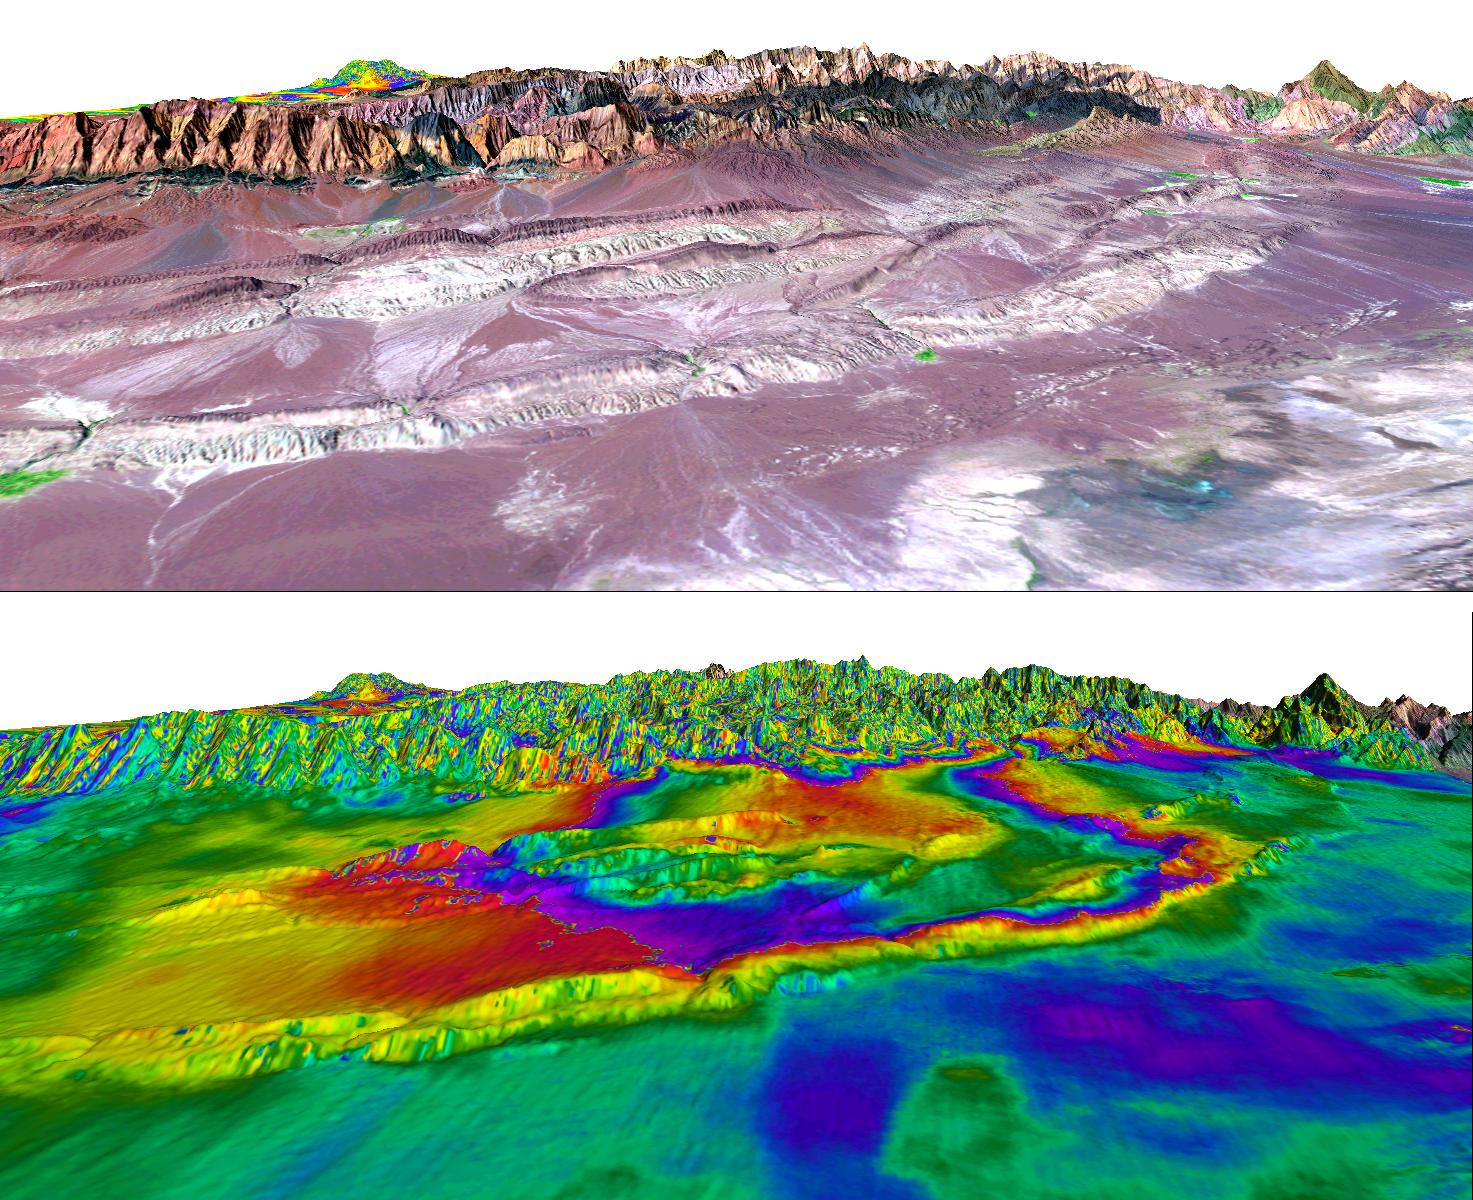
The two images show the same three-dimensional perspective view with a
Landsat image showing the surface geology in the top image, and the radar
interferometry data showing the surface deformation in the bottom image.
The town of Shahdad is at the right edge (north) of the images, which are
each roughly 50 kilometers (30 miles) wide. In the top image, the light
gray linear features running from lower left to upper right across the
scene are small ridges that are related to the Shahdad thrust fault. The
rainbow colors in the bottom image show contours of the motion of the
surface. The big loops in the red tones sweeping out across the low
ridges of the Shahdad thrust fault area show the area where the Shahdad
fault slipped beneath the surface, with motion towards the east (front
of the perspective view). The 1998 earthquake struck a valley on the
other side of the mountains in the background of this view.
For more information, see the following paper, published recently in the
journal Geology:
Fielding, E.J., Wright, T.J., Muller, J., Parsons, B.E. and Walker, R.
(2004), Aseismic deformation of a fold-and-thrust belt imaged by SAR
interferometry near Shahdad, southeast Iran, v. 32, no. 7.
The full paper is available (subscription required) at
http://www.gsajournals.org/perlserv/?request=get-document&doi=10.1130%2FG20452.1
and for United States Government research a reprint is available at:
http://trs-new.jpl.nasa.gov/dspace/handle/2014/6130.
Radar data used in this research were acquired by the European Remote
Sensing (ERS) satellites operated by the European Space Agency, which
kindly made this data available for research. Part of this research was
performed at the Jet Propulsion Laboratory, California Institute of
Technology under contract with the U.S. National Aeronautics and Space
Administration. Research was also performed at the Centre for the
Observation and Modelling of Earthquakes and Tectonics supported by
the U.K. Natural Environment Research Council, and at Stanford University.
Landsat has been providing visible and infrared views of the Earth since
1972. The Landsat archive is managed by the U.S. Geological Survey's Eros
Data Center (USGS EDC).
Size: View is approximately 50 kilometers (30 miles) wide and scale varies in this perspective
Location: 30.0 degrees North latitude, 58.0 degrees East longitude
Orientation: View to the west, 2 times vertical exaggeration. North is to the right
Image Data: Landsat Bands 5, 4, 2 as red, green, blue, respectively (Top). ERS radar interferometric motion contours, 28 millimeters (1 inch) per contour (Bottom)
Image resolution: Landsat: 30 meters (98 feet), Radar: 40 meters (131 feet)
Dates Acquired: May 27, 1996 and September 14, 1998 (ERS radar)


