Correcting Ocean Cooling
Posted November 6, 2008

Because of the unusually high heat capacity of water and the tremendous volume of water on the Earth’s surface, the oceans are absorbing most of the excess heat from global warming. In 2004, ocean scientist Josh Willis of NASA’s Jet Propulsion Laboratory documented that the top several hundred meters of the global ocean had warmed and expanded between 1993-2003. Surprisingly, however, a follow-up study spanning 2003-2005 seemed to show that the ocean had cooled.
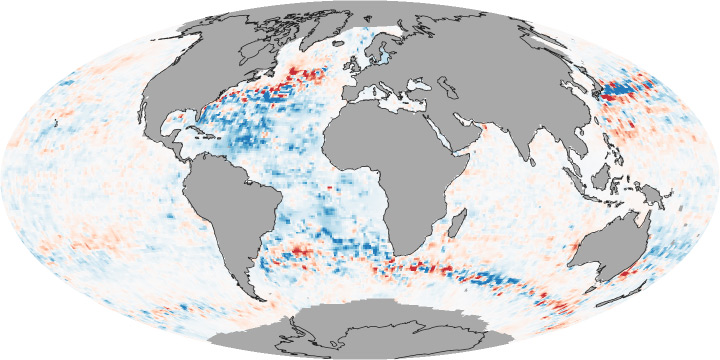
Willis initially interpreted the cooling as a temporary fluctuation, a “speed bump” on the road to more global warming; scientists know that global warming won’t stop year-to-year variability in the climate. But as data from aquatic robots known as Argo floats continued to accumulate through 2006, Willis began to realize something was wrong. A map of heat change at depths of 500 meters (top) showed an unrealistically widespread and dramatic cooling of the entire Atlantic Ocean (dark blue) between 2004-2006. Also, other indicators of ocean heat—satellite measurements of the balance of incoming and outgoing energy at the top of the atmosphere, and satellite and buoy data on sea level rise—didn’t show the cooling trend.
To resolve these inconsistencies, Willis and other scientists painstakingly compared observations of temperature collected at the same place and time by different sensors. Ultimately, they tracked the false cooling trend to problems with two types of ocean temperature data used in the original analysis. When the errors had been corrected, the global-scale cooling trend disappeared (bottom map). The remaining large swings in temperature visible in these maps are due to shifting positions of ocean currents.
The feature story Correcting Ocean Cooling describes how Willis and other scientists discovered and corrected the problems in the ocean data that initially caused them to think the ocean had cooled since 2003.
Maps by Robert Simmon, based on data from Josh Willis and John Lyman. Caption by Rebecca Lindsey.
- Dates Acquired:
- January 1, 2004 - December 31, 2006