 |
|
|
|
|
|
|
|
|
|
|
|
|
|
|
|
|
||||
| ||||||||||
|
|
|
|
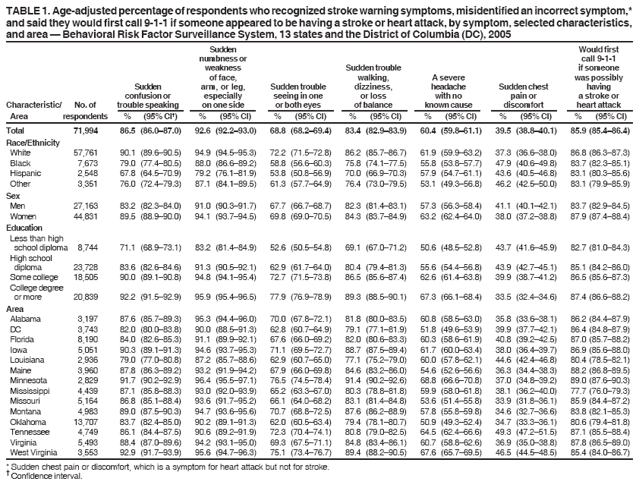
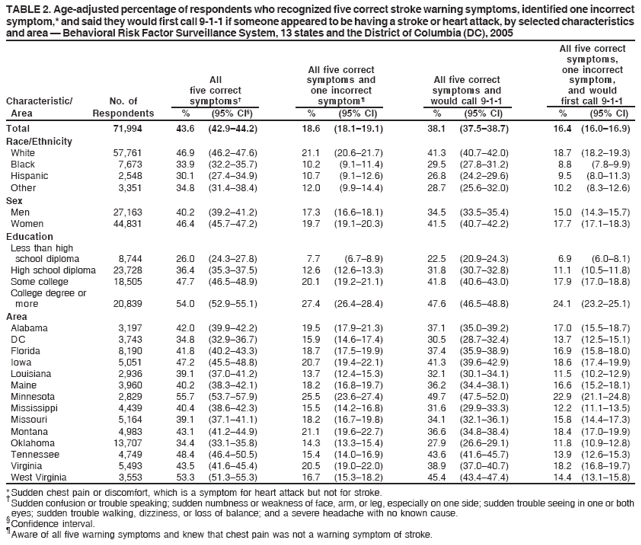
Awareness of Stroke Warning Symptoms --- 13 States and the District of Columbia, 2005Although the number of deaths from stroke has declined substantially since the 1960s (1,2), in 2004, stroke remained the third leading cause of death in the United States, after heart disease and cancer (3). Approximately 54% of U.S. stroke deaths in 2004 occurred outside of a hospital (4). Intravenous administration of tissue plasminogen activator has clinical benefits for patients with acute ischemic stroke; however, treatment should begin within 3 hours of symptom onset for these benefits to be realized (5). For hemorrhagic stroke, immediate surgery (e.g., aneurysm repair) is crucial to prevent rebleeding that results in serious impairment or death in 40% to 60% of cases (6). A revised objective of Healthy People 2010 is to increase to 83% the proportion of persons who are aware of the warning symptoms of stroke and the need to telephone 9-1-1 immediately if someone appears to be having a stroke (objective no. 12-8) (7). To assess public awareness of stroke warning symptoms and the importance of seeking emergency care, CDC analyzed data from an optional module of the 2005 Behavioral Risk Factor Surveillance System (BRFSS) survey that was used in 13 states and the District of Columbia (DC). The results indicated that the percentages of respondents who recognized all five correct symptoms, identified an incorrect symptom, and recognized the need to telephone 9-1-1 was low; the percentage who met all three measures was 16.4%. In addition, disparities were observed by race/ethnicity, sex, and education level. Public health agencies, clinicians, and educators should continue to stress the importance of learning to recognize stroke symptoms and the need to telephone 9-1-1 when someone appears to be having a stroke. BRFSS is a state-based, random-digit--dialed telephone survey of the U.S. civilian, noninstitutionalized population aged >18 years and is conducted in all 50 states, DC, Guam, Puerto Rico, and the U.S. Virgin Islands. However, in 2005, the optional heart attack and stroke module was included in the BRFSS surveys of 13 states* and DC. A total of 71,994 respondents answered questions regarding symptoms of stroke.† An incorrect symptom was included in another question ("Do you think sudden chest pain or discomfort is a symptom of stroke?") to assess the possibility that respondents might answer "yes" to all of the questions in the series without actually considering them. Respondents also were asked to select the one action they would do first, from the following list of actions, if they thought that someone was having a heart attack or stroke: take the person to the hospital, advise the person to call a doctor, call 9-1-1, call a spouse or family member, or do something else. Median response rate for the 13 states and DC, based on Council of American Survey and Research Organizations (CASRO) guidelines, was 54.5% (range: 45.1%--61.3%). Data were weighted to 2005 state population estimates. Age-adjusted prevalence estimates and 95% confidence intervals (CIs) were calculated; statistically significant differences between characteristics were determined by nonoverlapping CIs. Respondent awareness of stroke warning symptoms was 92.6% for sudden numbness or weakness of the face, arm, or leg, especially on one side; 86.5% for sudden confusion or trouble speaking; 83.4% for sudden trouble walking, dizziness, or loss of balance; 68.8% for sudden trouble seeing in one or both eyes; and 60.4% for a severe headache with no known cause. In addition, 85.9% of respondents said they would call 9-1-1 if they thought someone was having a heart attack or stroke. However, 39.5% of respondents incorrectly identified sudden chest pain or discomfort (which is a warning symptom of a heart attack) as a warning symptom of stroke (Table 1). Awareness of individual stroke warning symptoms varied by race/ethnicity, sex, and level of education. Whites, women, and persons at higher education levels were more likely to be aware of individual stroke warning symptoms and more likely to call 9-1-1 if they thought that someone was having a heart attack or stroke than were blacks, Hispanics, men, and persons at lower levels of education (Table 1). Awareness of individual stroke warning symptoms also varied by area. Respondent awareness ranged from 87.2% (Louisiana) to 96.4% (Minnesota) for sudden numbness or weakness of the face, arm, or leg, especially on one side; from 79.0% (Louisiana) to 92.9% (West Virginia) for sudden confusion or trouble speaking; from 77.1% (Louisiana) to 91.4% (Minnesota) for sudden trouble walking, dizziness, or loss of balance; from 62.0% (Oklahoma) to 76.5% (Minnesota) for sudden trouble seeing in one or both eyes; and from 51.8% (DC) to 68.8% (Minnesota) for severe headache with no known cause. The percentage of respondents who reported that they would call 9-1-1 if they thought someone was having a heart attack or stroke ranged from 77.7% (Mississippi) to 89.0% (Minnesota) (Table 1). All five stroke warning symptoms were identified by 43.6% of respondents; 18.6% were aware of all stroke warning symptoms and knew that sudden chest pain is not a stroke warning sign; 38.1% were aware of all stroke warning symptoms and would first call 9-1-1 if they thought that someone was having a heart attack or stroke, and 16.4% were aware of all five stroke warning symptoms, knew that sudden chest pain is not a stroke warning symptom, and would call 9-1-1 if they thought that someone was having a heart attack or stroke (Table 2). Awareness of all five stroke warning symptoms and calling 9-1-1 was higher among whites (41.3%), women (41.5%), and persons at higher education levels (47.6% for persons with a college degree or more) than among blacks and Hispanics (29.5% and 26.8%, respectively), men (34.5%), and persons at lower education levels (22.5% for those who had not received a high school diploma). Among states, the same measure ranged from 27.9% (Oklahoma) to 49.7% (Minnesota). Reported by: J Fang, MD, NL Keenan, PhD, C Ayala, PhD, S Dai, MD, PhD, R Merritt, MA, Div for Heart Disease and Stroke Prevention, National Center for Chronic Disease Prevention and Health Promotion; CH Denny, PhD, Div of Birth Defects and Developmental Disabilities, National Center on Birth Defects and Developmental Disabilities, CDC. Editorial Note:Immediate emergency transportation to a hospital to receive timely urgent care can reduce disability and even death associated with stroke. The American Stroke Association and National Stroke Association are working with state and local health departments to increase public recognition of stroke warning symptoms and 9-1-1 calls that prioritize these symptoms as "possible stroke." In addition, some states with heart disease and stroke prevention programs are conducting activities to increase public awareness of the symptoms of heart attack and stroke and the importance of calling 9-1-1 (8). The 2005 results in this report indicate no improvement in awareness of stroke warning symptoms from the 2001 survey (9), although direct comparisons cannot be made because the areas participating in the optional heart attack and stroke module differed in 2005 (13 states and DC) from 2001 (17 states and the U.S. Virgin Islands). In both surveys, few respondents (17.2% in 2001 and 16.4% in 2005) recognized all five stroke warning symptoms, knew that sudden chest pain is not a stroke symptom, and said they would call 9-1-1 immediately if they thought someone was having a stroke or heart attack. Urgent public health efforts are needed to increase the percentage of respondents who meet these measures and should focus on those symptoms with the least awareness (i.e., severe headache with no known cause and sudden trouble seeing in one or both eyes). Disparities in awareness of stroke warning symptoms and knowing the importance of telephoning 9-1-1 suggest that public health efforts should be targeted to blacks, Hispanics, men, and persons with less education. A 2006 study determined that Hispanics who only spoke Spanish were less likely than Hispanics who also spoke English to be aware of stroke warning symptoms and what action to take if they thought someone was having a stroke or heart attack (10). In areas in which awareness of stroke warning symptoms is lower, state and local health departments should consider working together to implement general public awareness campaigns. The findings in this report are subject to at least four limitations. First, BRFSS excludes households without landline telephones, including those households with only cellular telephones. Second, only 13 states and DC participated in the heart attack and stroke module in 2005; therefore, the results might not be generalizable to the entire population of the United States. Third, the finding in this report regarding the percentage of respondents who identified all five stroke warning symptoms (43.6%) differed substantially from the previously reported estimate of 78% from the 2001 National Health Interview Survey (NHIS), which was used as the initial baseline for objective 12-8 in Healthy People 2010 (7). However, the two results are not directly comparable. NHIS results are representative of the U.S. population, whereas the 2005 BRFSS respondents represented a population with landline telephones in 13 states and DC. Questioning in the two surveys also was structured differently. The NHIS questions did not cover the need to call 9-1-1 and also did not include an incorrect symptom as a check against persons who might answer "yes" to all the stroke symptom awareness questions without actually considering them. Finally, the data collected did not enable determination of whether participants who misidentified the incorrect stroke symptom did not know the correct answer or did not consider the question. Receiving treatment quickly after a stroke is critical to lowering the risk for disability and even death. Rapid treatment requires that persons 1) recognize the warning symptoms of stroke and 2) call 9-1-1 immediately. These findings indicate a need to increase awareness of stroke warning symptoms in the entire population, and particularly among blacks, Hispanics, men, and persons at lower education levels. In addition, increased education efforts in multiple languages might help improve awareness among non-English-speaking Hispanics and others. References
* Alabama, Florida, Iowa, Louisiana, Maine, Minnesota, Mississippi, Missouri, Montana, Oklahoma, Tennessee, Virginia, and West Virginia. † "Do you think sudden confusion or trouble speaking are symptoms of stroke?" "Do you think sudden numbness or weakness of face, arm, or leg, especially on one side, are symptoms of stroke?" "Do you think sudden trouble seeing in one or both eyes is a symptom of stroke?" "Do you think sudden trouble walking, dizziness, or loss of balance are symptoms of stroke?" "Do you think a severe headache with no known cause is a symptom of stroke?" Table 1
Disclaimer All MMWR HTML versions of articles are electronic conversions from ASCII text into HTML. This conversion may have resulted in character translation or format errors in the HTML version. Users should not rely on this HTML document, but are referred to the electronic PDF version and/or the original MMWR paper copy for the official text, figures, and tables. An original paper copy of this issue can be obtained from the Superintendent of Documents, U.S. Government Printing Office (GPO), Washington, DC 20402-9371; telephone: (202) 512-1800. Contact GPO for current prices. **Questions or messages regarding errors in formatting should be addressed to mmwrq@cdc.gov.Date last reviewed: 5/8/2008 |
|||||||||
|