|
PIA00365: Flooding Resulting From Hurricane Isidore,
Comparing Data from
September 12 and 28, 2002
|
|
|
Click on the image to download a moderately sized image in
JPEG format (possibly reduced in size from original).
|
- Original Caption Released with Image:
-
 |
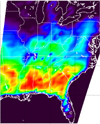
 | | Figure 1: GOES-8, 0815 UT, Sep 12, 2002 | Figure 2: GOES-8, 0815 UT, Sep 28, 2002 |
 |
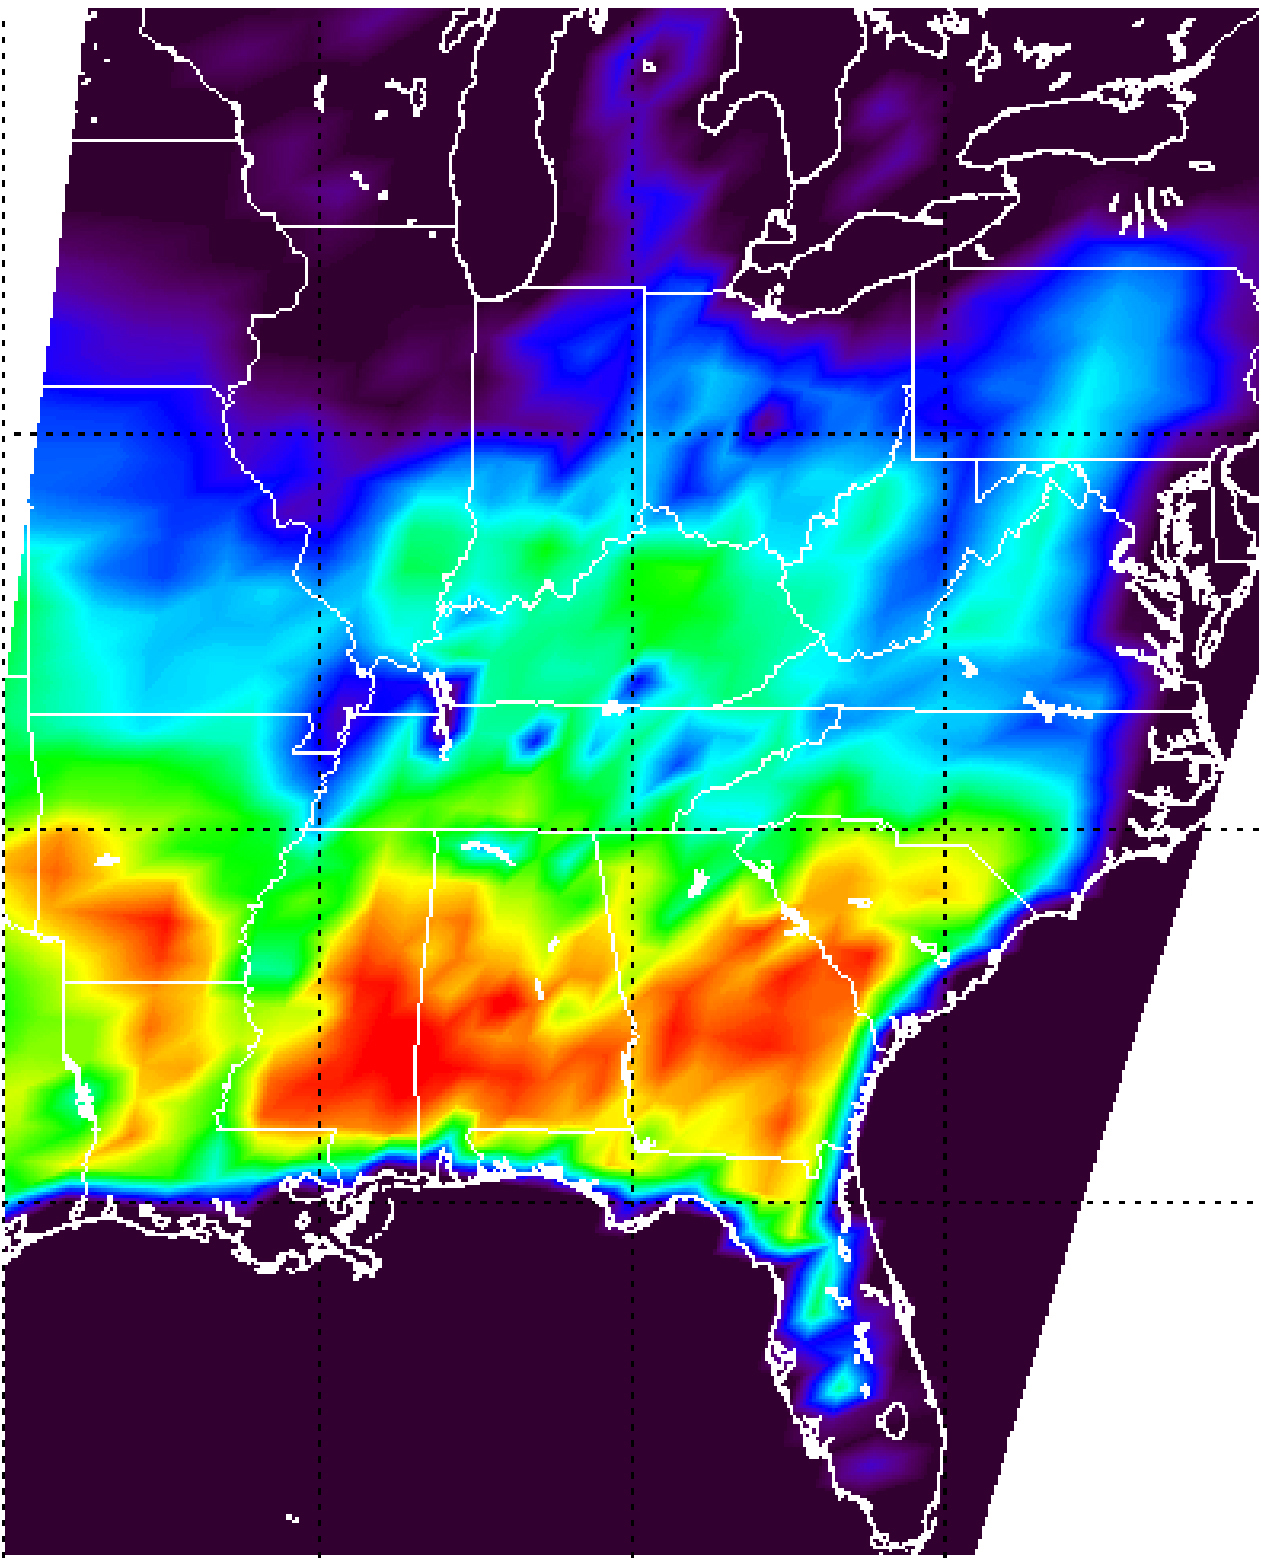
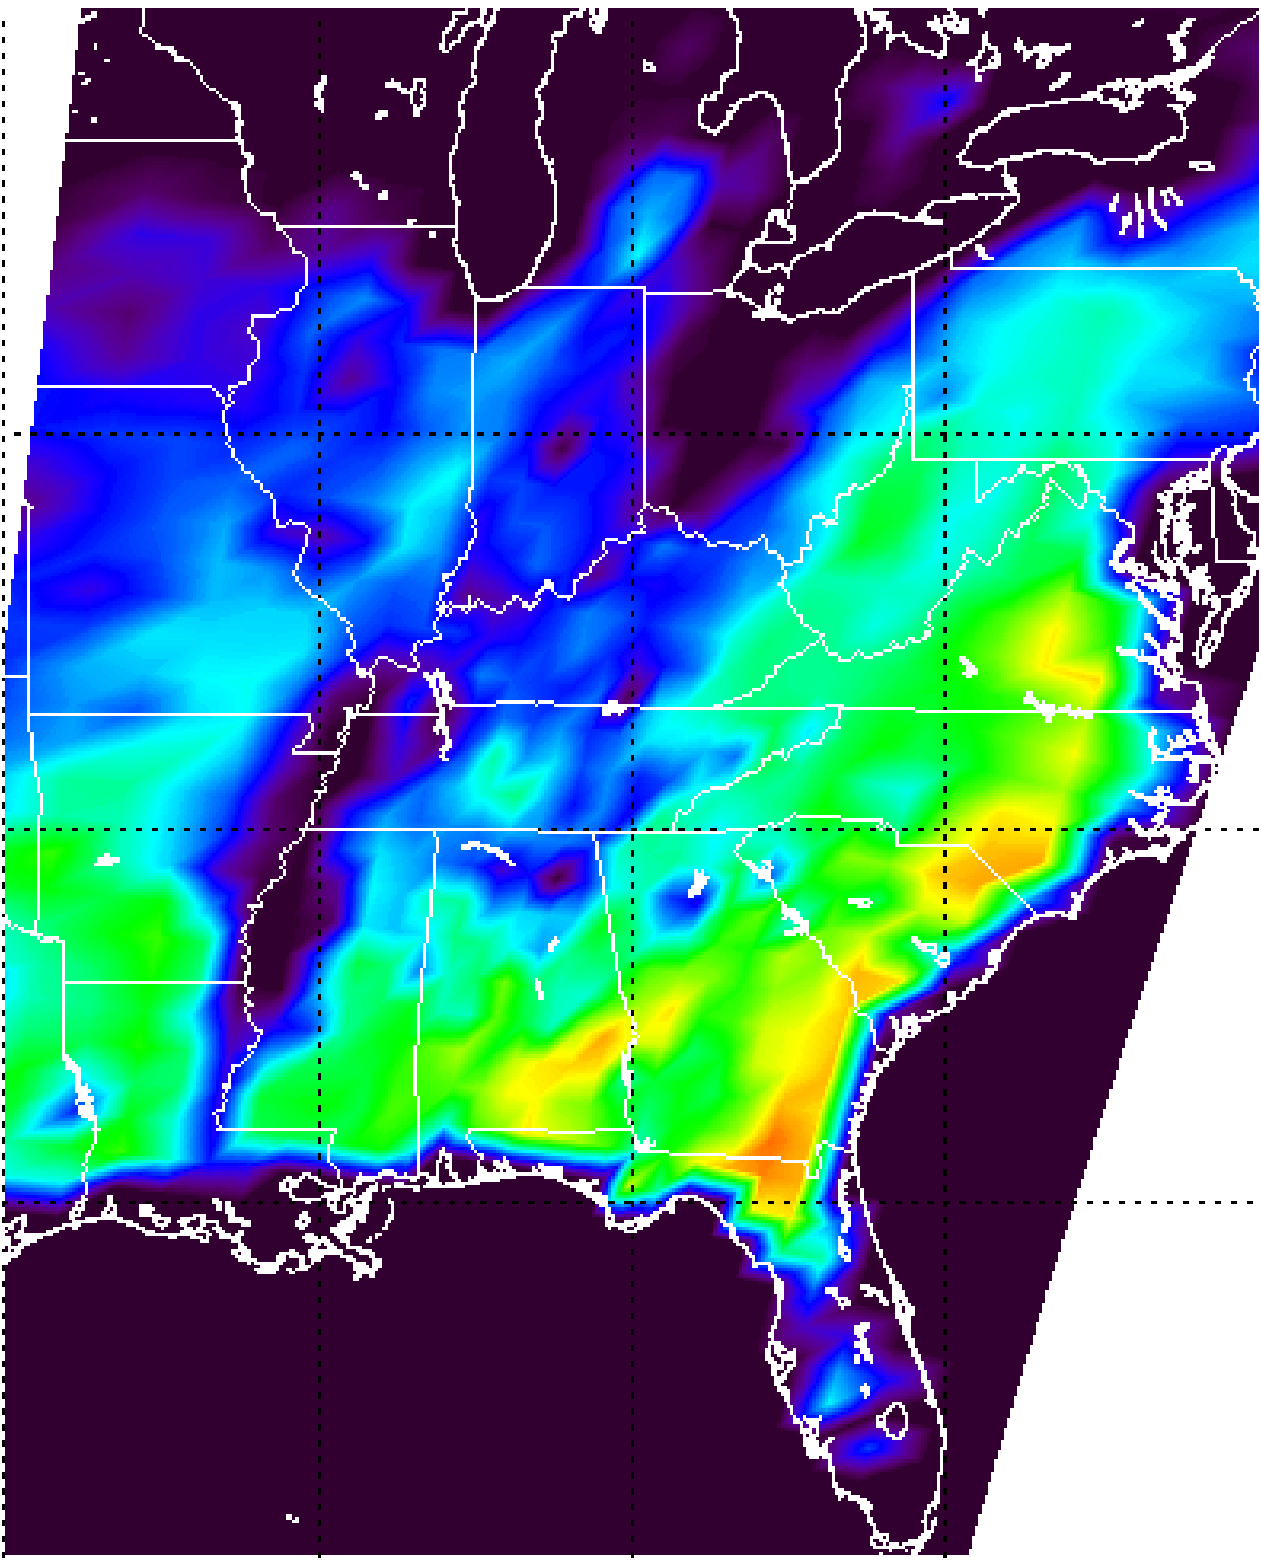
 | | Figure 3: AMSU-A channel 2, Sep 12, 2002 | Figure 4: AMSU-A channel 2, Sep 28, 2002 |
Extent of Flooding due to Hurricane Isidore revealed in
images from the Atmospheric Infrared Sounding System (AIRS) on Aqua
Tropical Storm Isidore was born in mid-September north of Venezuela. It
subsequently hit Mexico's Yucatan Peninsula as a Category 3 hurricane and
came ashore near New Orleans on September 26th packing winds just below
hurricane strength. Around the time of September 27, the storm was
downgraded to a tropical depression as the system moved into Tennessee.
At the time the Aqua spacecraft first passed over Isidore, it was
classified as a Category 3 (possibly 4) hurricane, with minimum pressure
of 934 mbar, maximum sustained wind speeds of 110 knots (gusting to 135)
and an eye diameter of 20 nautical miles. Isidore was later downgraded to
a Tropical Storm and then a Tropical Depression as it lost energy.
Figures 1 and 2, two images from the National Oceanic and Atmospheric
Administration's Geostationary Operational Environmental Satellites show
no significant weather systems over the southeastern United States on
September 12 and September 28 (16 days apart). However, the microwave
component of the Atmospheric Infrared Sounder Experiment on NASA's Aqua
spacecraft shows a striking difference. The difference in the two
microwave images (figures 3 and 4) from the AIRS Advanced Microwave
Sounding Unit is primarily due to flooding after Tropical Storm Isidore.
Water has a very low surface emissivity at this frequency, and that
causes surface water to appear very cold (even though it is not). Land
appears relatively warm (well above freezing - 273 K, even at night as
seen is these images), but if there is standing water, the apparent
temperature drops precipitously. Figure 4, taken just about a day after
the remnants of Isidore passed over the southeast, shows heavy flooding
along the Mississippi, especially in the states of Mississippi and
Tennessee, but other states are also affected. The spatial resolution of
the AMSU-A instrument is relatively large (each measurement spot is about
25 miles in diameter at the center of the swath), but the enormous thermal
contrast in the microwave between land and water makes even small flooded
areas stand out.
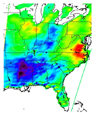
Figure 5: Difference image, 9/12 and 9/28)
The Aqua spacecraft has an exact 16-day repeat cycle, that is why the
pre-Isidore image is 16 days prior to the post-Isidore image. They have
exactly the same coverage, which makes it possible to obtain a difference
image (figure 5). The difference image is the difference between the
September 28 and September 12 images shown. In the difference image,
white indicates no difference at all, green is very little difference,
blue/purple indicates primarily heavy flooding. Red indicates warming
likely due to warmer weather. (The straight lines on the right and left
edges of the difference image are caused by slight differences between
the two repeat passes of Aqua).
The Atmospheric Infrared Sounder Experiment, with its visible, infrared,
and microwave detectors, provides a three-dimensional look at Earth's
weather. Working in tandem, the three instruments can make simultaneous
observations all the way down to the Earth's surface, even in the presence
of heavy clouds. With more than 2,000 channels sensing different regions
of the atmosphere, the system creates a global, 3-D map of atmospheric
temperature and humidity and provides information on clouds, greenhouse
gases, and many other atmospheric phenomena. The AIRS Infrared Sounder
Experiment flies onboard NASA's Aqua spacecraft and is managed by NASA's
Jet Propulsion Laboratory, Pasadena, Calif., under contract to NASA. JPL
is a division of the California Institute of Technology in Pasadena.
- Image Credit:
-
NASA/JPL
| |

|


