 |
Current Radar
The Current Radar map shows areas of current precipitation. A weather radar is used to locate precipitation, calculate its motion, estimate its type (rain, snow, hail, etc.), and forecast its future position and intensity. Modern weather radars are mostly doppler radars, capable of detecting the motion of rain droplets in addition to intensity of the precipitation. Both types of data can be analyzed to determine the structure of storms and their potential to cause severe weather. Precipitation type is indicated by the color - green is rain, pink is a mix of rain, freezing rain, sleet, and/or snow, and blue is snow. This is the current map for Radar.
Other Maps of Interest:
» View the Various Surface Analysis Maps
» View the Current Satellite Maps
» See the 10-Day Departure Outlook
» View the recent changes in temperature
|
 |
The satellite images displayed are infrared (IR) images. Warmest (lowest) clouds are shown in white; coldest (highest) clouds are displayed in shades of yellow, red, and purple.
|
 |
The Current Surface Analysis image shows current weather conditions, including frontal and high/low pressure positions, satellite infrared (IR) cloud cover, and areas of precipitation.
|
 |
The Daily Precipitation image shows accumulated precipitation for the last 24 hours.
|
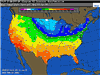 |
The High Temperatures Today image shows the forecast high temperatures for the current day, color contoured every 10 degrees F.
|
|
|
|
RainCast
|
Daily Precipitation
|
WINDcast
|
Golfing
|
Painting
|
Gardening
|
|
|
More Areas of Interest
|
Storm Center
 |
Maps displaying current National Weather Service Watches, Warnings and Advisories via County Fill colors.
|
 |
Current National Weather Service Watches and Warnings by type and state throughout the United States.
|
|
|
|

|