Drought Monitor: Current Conditions | |
NDMC's Drought Impact Reporter | |
The Drought Impact Reporter is an interactive tool developed by the NDMC to collect, quantify, and map reported drought impacts for the United States. The tool was created in response to the need for a national drought impact database. Information for the impact report database comes from a variety of sources, including on-line drought-related news stories and scientific publications, reviewed by NDMC staff; members of the public who visit the website and submit a drought-related impact; members of the media; and members of government agencies such as NOAA and USDA. |
 |
Experimental Objective Blends of Drought Indicators Long-Term and Short-Term Percentiles | |
| The experimental Short-Term Blend approximates drought-related impacts that respond to precipitation (and secondarily other factors) on time scales ranging from a few days to a few months, such as wildfire danger, non-irrigated agriculture, topsoil moisture, range and pasture conditions, and unregulated streamflows. |  |
| The experimental Long-Term Blend approximates drought-related impacts that respond to precipitation on time scales ranging from several months to a few years, such as reservoir stores, irrigated agriculture, groundwater levels, and well water depth. |  |
National Weather Service's Precipitation Analysis (Experimental Product) | |
| The Precipitation Analysis Pages by the National Weather Service graphically show the short-term observed and climatic trends of precipitation across the lower 48 United States (CONUS) and Puerto Rico. | 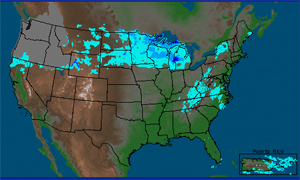 |
Weekly Weather and Crop Bulletin |
| The Weekly
Weather and Crop Bulletin is jointly prepared by the U.S. Department
of Commerce, National Oceanic and Atmospheric Administration, and the U.S.
Department of Agriculture. The bulletin is published weekly on Tuesdays. |
|
Palmer Drought Severity Index | |
The PDSI is updated weekly by the Climate Prediction Center. It is based on rainfall, temperature and historic data, and is computed based on a complex formula devised by W.C. Palmer in 1965. Although the Palmer is the main drought index used by the U.S. government, it is slow to detect fast-emerging droughts, and does not reflect snowpack, an important component of water supply in the western United States. |
 |
Crop Moisture Index | |
The Crop Moisture Index, updated weekly by the Climate Prediction Center, is a derivative of the Palmer Drought Index, designed to reflect quickly changing soil moisture conditions. |
 |
Standardized Precipitation Index | |
| The SPI is a relatively new drought index, based only on precipitation.
The SPI can be calculated for a variety of time scales. This flexibility
allows the SPI to be useful in both short-term agricultural and long-term
hydrological applications.
The product displayed here is based on data from the National Climatic Data Center, and on analysis by the Western Regional Climate Center and by the National Drought Mitigation Center. |
 |
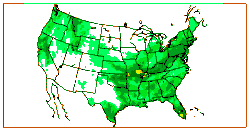
Percent of Normal Rainfall | |
Percent of normal rainfall for the past 30 and 90 days, updated daily. Based on comparisons with data from 1963 to 1995. From the Climate Prediction Center |
|
Daily Streamflow Map | |
| The map depicts streamflow conditions as measured at USGS gaging stations. The colors represent discharge as a percentile, which is computed from the period of record for the current day of the year. Only stations having at least 30 years of record are used. | 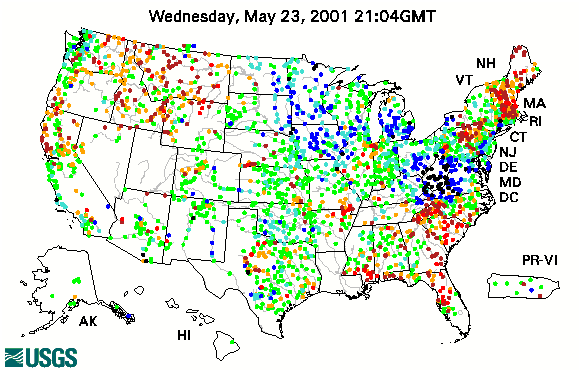 |
Snowpack | |
|
The Natural Resources Conservation Service updates snowpack maps monthly from fall to spring. For current snowpack maps, click the link above. |
|
Soil Moisture | |
|
From the Joint Agricultural Weather Facility of the U.S. Department of Agriculture and the National Oceanic and Atmospheric Administration |
 |
| Click the map for a depiction of current topsoil moisture vs. 5 year mean. |  |
| Click the map for a depiction of current topsoil moisture vs. 10 year mean. |  |
Daily Soil Moisture Anomaly | |
| Daily Soil Moisture Anomaly, from the Climate Prediction Center |  |
Vegetation and Temperature Condition Index | |
| in-depth information on the VT | 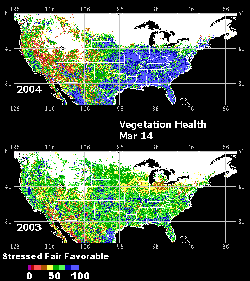 |
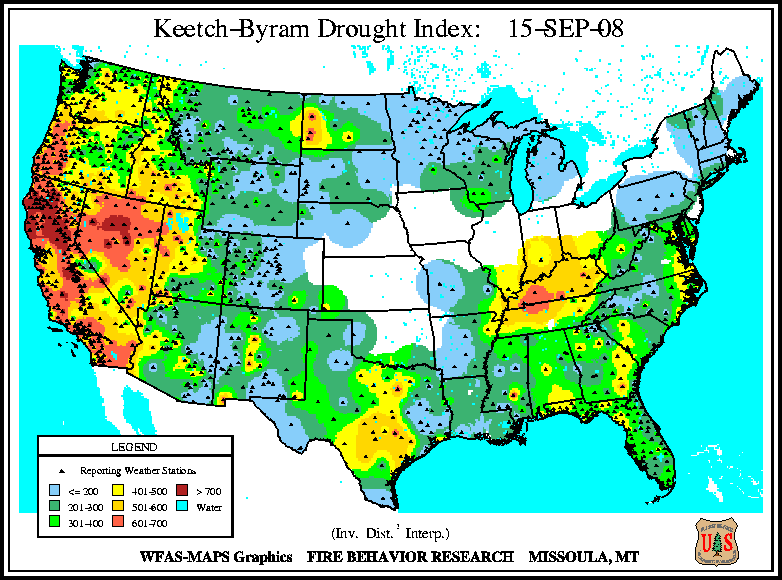
Observed Fire Danger Class | |
|
A Fire Danger Rating level takes into account current and antecedent weather, fuel types, and both live and dead fuel moisture. Courtesey of USDA Forest Service. Click here for
KBDI map |
 |
