|
|
National Weather Service Tucson Arizona drought monitoring page
| Southeast
Arizona Drought Monitoring |
| Latest
2 month precipitation |
|
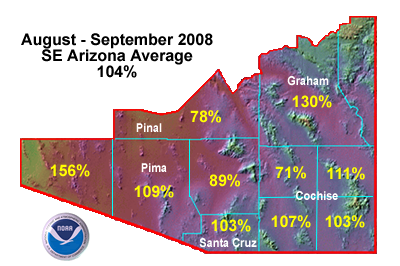
August - September 2008 (map) |
|
|
|
|
| Select
time frame above |
|
| Drought
Monitor Map |
 |
|
|
| |
Total |
Normal |
Difference |
%
of normal |
| Tucson |
1.94 |
3.75 |
-1.81 |
52 |
| Tucson 17 NW |
2.40 |
3.78 |
-1.38 |
63 |
| Tucson Campbell Ave |
5.67 |
3.28 |
2.39 |
173 |
| Tucson U of A (NWS) |
2.02 |
3.47 |
-1.45 |
58 |
| Green Valley |
4.80 |
5.25 |
-0.45 |
91 |
| Vail 7N |
4.68 |
4.53 |
0.15 |
103 |
| Redington |
3.47 |
3.91 |
-0.44 |
89 |
| Eastern
Pima County |
3.57 |
4.00 |
-0.43 |
89 |
|
|
|
| Anvil Ranch |
3.48 |
4.08 |
-0.60 |
85 |
| Arivaca |
7.82 |
5.84 |
1.98 |
134 |
| Kitt Peak |
7.60 |
6.89 |
0.71 |
110 |
| Sasabe INS |
6.30 |
5.29 |
1.01 |
119 |
| Sells |
5.60 |
4.91 |
0.69 |
114 |
| Central
Pima County |
6.16 |
5.64 |
0.52 |
109 |
|
|
|
| Ajo |
2.28 |
2.44 |
-0.16 |
93 |
| Organ Pipe N.M. |
6.29 |
3.05 |
3.24 |
206 |
| Western
Pima County |
4.29 |
2.75 |
1.54 |
156 |
|
|
|
| Oracle 2 SE |
2.04 |
6.05 |
-4.01 |
34 |
| Picacho 8 SE |
1.92 |
2.69 |
-0.77 |
71 |
| San Manuel |
2.80 |
4.15 |
-1.35 |
67 |
| Kearny |
0.00 |
3.07 |
-3.07 |
0 |
| SE
Pinal County |
2.01 |
3.53 |
-1.52 |
57 |
|
|
|
| Nogales 6 N |
3.91 |
5.92 |
-2.01 |
66 |
| Patagonia #2 |
5.04 |
5.74 |
-0.70 |
88 |
| Canelo |
8.18 |
5.51 |
2.67 |
148 |
| Tumacacori N.M. |
6.35 |
5.69 |
0.66 |
112 |
| Santa
Cruz County |
5.87 |
5.72 |
0.16 |
103 |
|
|
|
| Fort Thomas 2 SW |
2.93 |
2.39 |
0.54 |
123 |
| Safford Ag. Center |
4.22 |
2.84 |
1.38 |
149 |
| Duncan |
3.88 |
3.24 |
0.64 |
120 |
| Clifton |
3.18 |
3.78 |
-0.60 |
84 |
| Gila
River Valley |
3.68 |
2.82 |
0.85 |
130 |
|
|
|
| Benson 6 SE |
6.01 |
4.89 |
1.12 |
123 |
| Cascabel |
1.83 |
4.21 |
-2.38 |
43 |
| Pearce-Sunsites |
2.69 |
4.41 |
-1.72 |
61 |
| Willcox |
1.85 |
3.86 |
-2.01 |
48 |
| NW
Cochise |
3.10 |
4.34 |
-1.25 |
71 |
|
|
|
| Bisbee #2 |
6.55 |
6.33 |
0.22 |
103 |
| Coronado N.M. HQ |
6.14 |
5.53 |
0.61 |
111 |
| Sierra Vista |
4.42 |
5.14 |
-0.72 |
86 |
| Tombstone |
3.81 |
4.61 |
-0.80 |
83 |
| Y Lightning Ranch |
7.18 |
4.73 |
2.45 |
152 |
| SW
Cochise |
5.62 |
5.27 |
0.35 |
107 |
|
|
|
| Bowie |
4.88 |
3.26 |
1.62 |
150 |
| Chiricahua N.M. |
6.19 |
5.74 |
0.45 |
108 |
| Portal |
6.71 |
6.05 |
0.66 |
111 |
| San Simon |
2.56 |
3.20 |
-0.64 |
80 |
| NE
Cochise |
5.09 |
4.56 |
0.52 |
111 |
|
|
|
| Douglas |
4.26 |
4.51 |
-0.25 |
94 |
| McNeal |
3.89 |
4.10 |
-0.21 |
95 |
| Rucker Canyon |
6.48 |
5.62 |
0.86 |
115 |
| SE
Cochise |
4.88 |
4.74 |
0.13 |
103 |
|
|
|
| SE
Arizona |
4.42 |
4.34 |
0.09 |
102 |
| |
|
|
|
|
|
| Southeast
Arizona percentage of normal maps |
 |
| Back to top |
|
|
|
Webmaster
US Dept of Commerce
National Oceanic and Atmospheric Administration
National Weather Service
Tucson Weather Forecast Office
520 North Park Ave, Suite 304
Tucson, AZ 85719
Tel: (520) 670-6526
|
Disclaimer
Information Quality
Credits
Glossary |
Privacy Policy
Freedom of Information Act
About Us
Career Opportunities
|
National Weather Service Mission: "The
National Weather Service (NWS) provides weather,
hydrologic, and climate forecasts and warnings for
the United States, its territories, adjacent waters
and ocean areas, for the protection of life and
property and the enhancement of the national economy.
NWS data and products form a national information
database and infrastructure which can be used by
other governmental agencies, the private sector,
the public, and the global community." |
|
|


