|
|
|||
State Energy Profile - ArizonaEnergy Information Administration - State Energy Profileshttp://tonto.eia.doe.gov/state |
||||||
|---|---|---|---|---|---|---|
|
||||||
|
Last Update: January 02, 2009
Next Update: January 08 , 2009 |
||||||
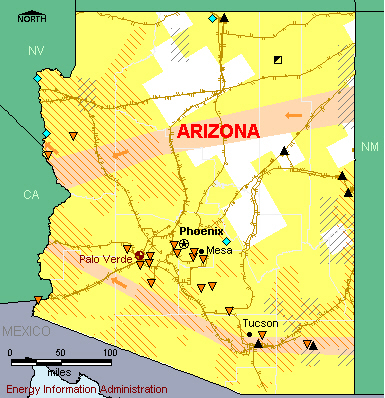
OverviewResources and ConsumptionArizona has substantial coal deposits but few other fossil fuel resources. The coal deposits are concentrated in the Black Mesa Basin in the northeast part of the State. Arizona has one nuclear power plant and extensive solar energy potential. Its large desert areas offer the highest solar power potential in the country, and the Colorado River is a tremendous source of hydropower. While Arizona ranks near the middle of the States in total energy consumption, per capita energy consumption is low, and the State economy is not energy intensive. The transportation sector is the leading energy-consuming sector in the State. PetroleumArizona’s annual crude oil production is minimal. Arizona has no refineries and receives its petroleum product supply via two pipelines, one from southern California and the other from El Paso, Texas. In summer 2003, a rupture on the line from El Paso caused an oil spill and shut down the section between Tucson and Phoenix. The accident caused shortages at Phoenix area motor gasoline fueling stations. A new refinery in Yuma County, Arizona, about 100 miles southwest of Phoenix, has been proposed and is expected to be operational by 2010. The refinery would receive crude oil supplies via a pipeline from Mexico and would ease motor gasoline supply constraints throughout the State. An oxygenated motor gasoline blend is used in the Tucson area during the winter and in Maricopa County (Phoenix) year-round. Natural GasArizona relies on interstate deliveries to meet most of its natural gas demand. Several major natural gas pipelines from production areas in Texas and the Rocky Mountains supply Arizona markets as they flow west towards southern California. The electric power sector dominates natural gas consumption in Arizona, consuming roughly three-fourths of State supply. Winters are generally mild and almost two-fifths of Arizona households rely on natural gas as their primary energy source for home heating. Coal, Electricity, and RenewablesArizona's coal production takes place primarily in the Black Mesa Basin and large volumes of coal move in and out of the State via rail. More than one-third of the coal produced in Arizona is delivered to coal-fired generators in Nevada. The remaining two-thirds, along with coal supplies transported primarily from New Mexico, are consumed at power plants in the State. Coal-fired plants supply roughly two-fifths of Arizona’s demand for electricity. Natural gas-fired plants and nuclear power supply most of the remainder. Arizona’s sole nuclear power plant, the 3-unit Palo Verde plant, provides about one-fourth of the State's total electricity generation. Palo Verde is the Nation's largest nuclear plant and has the second-highest rated capacity of any power plant in the United States. The Glen Canyon and Hoover Dams, both located on the Colorado River in northern Arizona, provide hydroelectric power. Although Arizona leads the Nation in solar power potential, its solar-powered generation facilities are small and the State has not yet developed its solar resource on a large scale. More than one-half of Arizona households rely on electricity as their primary energy source for home heating. |
|
| Economy | ||||
| Population and Employment | Arizona | U.S. Rank | Period | |||||||
| Population | 6.5 million | 17 |
2008 | |||||||
| Civilian Labor Force | 3.1 million | 21 |
2007 | |||||||
| Per Capita Personal Income | $33,029 | 41 |
2007 | |||||||
| Industry | Arizona | U.S. Rank | Period | |||||||
| Gross Domestic Product by State | $247.0 billion | 17 | 2007 | |||||||
| Land in Farms | 26.6 million acres | 16 |
2002 | |||||||
| Market Value of Agricultural Products Sold | $2.4 billion | 29 |
2002 | |||||||
| Prices | ||||
| Petroleum | Arizona | U.S. Avg. | Period | |||||||
| Domestic Crude Oil First Purchase | — | $73.22/barrel | Oct-08 | |||||||
| No. 2 Heating Oil, Residential | — | $3.168/gal | Oct-08 | |||||||
| Regular Motor Gasoline Sold Through Retail Outlets (Excluding Taxes) | $2.694/gal | $2.527/gal | Oct-08 | |||||||
| State Tax Rate on Motor Gasoline (other taxes may apply) |
$0.18/gal | $0.2159/gal | Aug-08 | |||||||
| No. 2 Diesel Fuel Sold Through Retail Outlets (Excluding Taxes) | — | $3.021/gal | Oct-08 | |||||||
| State Tax Rate on On-Highway Diesel (other taxes may apply) |
$0.18/gal | $0.2214/gal | Aug-08 | |||||||
| Natural Gas | Arizona | U.S. Avg. | Period | |||||||
| Wellhead | $5.70/thousand cu ft | $6.40/thousand cu ft | 2006 | |||||||
| City Gate | $5.67/thousand cu ft | $7.88/thousand cu ft | Oct-08 | |||||||
| Residential | $21.46/thousand cu ft | $15.23/thousand cu ft | Oct-08 | |||||||
| Coal | Arizona | U.S. Avg. | Period | |||||||
| Average Open Market Sales Price | W | $26.20/short ton | 2007 | |||||||
| Delivered to Electric Power Sector | $ 1.76/million Btu | $ 2.16 /million Btu | Sep-08 | |||||||
| Electricity | Arizona | U.S. Avg. | Period | |||||||
| Residential | 10.61 cents/kWh | 11.94 cents/kWh | Sep-08 | |||||||
| Commercial | 9.10 cents/kWh | 10.77 cents/kWh | Sep-08 | |||||||
| Industrial | 6.70 cents/kWh | 7.36 cents/kWh | Sep-08 | |||||||
|
|||||||||||||||||||||||||
| Reserves | Arizona | Share of U.S. | Period | ||||||||||||||||||||||
| Crude Oil | — | — | 2007 | ||||||||||||||||||||||
| Dry Natural Gas | — | — | 2007 | ||||||||||||||||||||||
| Natural Gas Liquids | — | — | 2007 | ||||||||||||||||||||||
| Recoverable Coal at Producing Mines | W | NA | 2007 | ||||||||||||||||||||||
| Rotary Rigs & Wells | Arizona | Share of U.S. | Period | ||||||||||||||||||||||
| Rotary Rigs in Operation | 0 | 0.0% | 2007 | ||||||||||||||||||||||
| Crude Oil Producing Wells | 12 | 0.0% | 2007 | ||||||||||||||||||||||
| Natural Gas Producing Wells | 7 | 0.0% | 2006 | ||||||||||||||||||||||
| Production | Arizona | Share of U.S. | Period | ||||||||||||||||||||||
| Total Energy | 611 trillion Btu | 0.9% | 2005 | ||||||||||||||||||||||
| Crude Oil | 5 thousand barrels | 0.0% | Aug-08 | ||||||||||||||||||||||
| Natural Gas - Marketed | 611 million cu ft | 0.0% | 2006 | ||||||||||||||||||||||
| Coal | 7,983 thousand short tons | NA | 2007 | ||||||||||||||||||||||
| Capacity | Arizona | Share of U.S. | Period | ||||||||||||||||||||||
| Crude Oil Refinery Capacity (as of Jan. 1) | 0 barrels/calendar day | 0.0% | 2008 | ||||||||||||||||||||||
| Electric Power Industry Net Summer Capability | 25,608 MW | 2.6% | 2006 | ||||||||||||||||||||||
| Net Electricity Generation | Arizona | Share of U.S. | Period | ||||||||||||||||||||||
| Total Net Electricity Generation | 11,117 thousand MWh | 3.3% | Sep-08 | ||||||||||||||||||||||
| Petroleum-Fired | 2 thousand MWh | 0.1% | Sep-08 | ||||||||||||||||||||||
| Natural Gas-Fired | 4,129 thousand MWh | 5.3% | Sep-08 | ||||||||||||||||||||||
| Coal-Fired | 3,872 thousand MWh | 2.4% | Sep-08 | ||||||||||||||||||||||
| Nuclear | 2,577 thousand MWh | 3.8% | Sep-08 | ||||||||||||||||||||||
| Hydroelectric | 515 thousand MWh | 3.1% | Sep-08 | ||||||||||||||||||||||
| Other Renewables | 3 thousand MWh | 0.0% | Sep-08 | ||||||||||||||||||||||
| Stocks | Arizona | Share of U.S. | Period | ||||||||||||||||||||||
| Motor Gasoline (Excludes Pipelines) | 686 thousand barrels | 1.1% | Oct-08 | ||||||||||||||||||||||
| Distillate Fuel Oil (Excludes Pipelines) | 348 thousand barrels | 0.4% | Oct-08 | ||||||||||||||||||||||
| Natural Gas in Underground Storage | — | — | Oct-08 | ||||||||||||||||||||||
| Petroleum Stocks at Electric Power Producers | 322 thousand barrels | 0.8 % | Sep-08 | ||||||||||||||||||||||
| Coal Stocks at Electric Power Producers | 2,834 thousand tons | 2.0% | Sep-08 | ||||||||||||||||||||||
| Production Facilities | Arizona | ||||||||||||||||||||||||
| Major Coal Mines | Kayenta/Peabody Western Coal Co. | ||||||||||||||||||||||||
| Petroleum Refineries | None | ||||||||||||||||||||||||
| Major Non-Nuclear Electricity Generating Plants | Navajo (Salt River Project) • Gila River Power Station (Panda Gila River LP) • Glen Canyon Dam (U S Bureau of Reclamation) • Santan (Salt River Project) • Springerville (Tucson Electric Power Co) | ||||||||||||||||||||||||
| Nuclear Power Plants | Palo Verde (Arizona Public Service Co) | ||||||||||||||||||||||||
| Distribution & Marketing | ||||
| Distribution Centers | Arizona | |||||||||
| Oil Seaports/Oil Import Sites | None | |||||||||
| Natural Gas Market Centers | None | |||||||||
| Major Pipelines | Arizona | |||||||||
| Crude Oil | None | |||||||||
| Petroleum Product | Kinder-Morgan | |||||||||
| Liquefied Petroleum Gases | None | |||||||||
| Interstate Natural Gas Pipelines | El Paso Natural Gas Co. • Questar Pipeline Co. • Southwest Gas Corp. • Transwestern Pipeline Co. | |||||||||
| Fueling Stations | Arizona | Share of U.S. | Period | |||||||
| Motor Gasoline | 2,000 | 1.2% | 2007 | |||||||
| Liquefied Petroleum Gases | 54 | 2.4% | 2007 | |||||||
| Compressed Natural Gas | 39 | 4.9% | 2007 | |||||||
| Ethanol | 14 | 1.0% | 2007 | |||||||
| Other Alternative Fuels | 25 | 2.2% | 2007 | |||||||
| Consumption | ||||
| per Capita | Arizona | U.S. Rank | Period | |||||||
| Total Energy | 248 million Btu | 45 | 2006 | |||||||
| by Source | Arizona | Share of U.S. | Period | |||||||
| Total Energy | 1,531 trillion Btu | 1.5% | 2006 | |||||||
| Total Petroleum | 110,807 thousand barrels | 1.5% | 2006 | |||||||
| Motor Gasoline | 69,307 thousand barrels | 2.1% | 2006 | |||||||
| Distillate Fuel | 26,839 thousand barrels | 1.8% | 2006 | |||||||
| Liquefied Petroleum Gases | 1,651 thousand barrels | 0.2% | 2006 | |||||||
| Jet Fuel | 7,721 thousand barrels | 1.3% | 2006 | |||||||
| Natural Gas | 358,136 million cu ft | 1.6% | 2006 | |||||||
| Coal | 21,247 thousand short tons | 1.9% | 2006 | |||||||
| by End-Use Sector | Arizona | Share of U.S. | Period | |||||||
| Residential | 397,919 billion Btu | 1.9% | 2006 | |||||||
| Commercial | 346,533 billion Btu | 2.0% | 2006 | |||||||
| Industrial | 234,673 billion Btu | 0.7% | 2006 | |||||||
| Transportation | 551,735 billion Btu | 1.9% | 2006 | |||||||
| for Electricity Generation | Arizona | Share of U.S. | Period | |||||||
| Petroleum | 3 thousand barrels | 0.1% | Sep-08 | |||||||
| Natural Gas | 30,217 million cu ft | 4.9% | Sep-08 | |||||||
| Coal | 1,990 thousand short tons | 2.3% | Sep-08 | |||||||
| for Home Heating (share of households) | Arizona | U.S. Avg. | Period | |||||||
| Natural Gas | 38% | 51.2% | 2000 | |||||||
| Fuel Oil | 0% | 9.0% | 2000 | |||||||
| Electricity | 54% | 30.3% | 2000 | |||||||
| Liquefied Petroleum Gases | 5% | 6.5% | 2000 | |||||||
| Other/None | 3% | 1.8% | 2000 | |||||||
| Environment | ||||
| Special Programs | Arizona | |||||||||
| Clean Cities Coalitions | Valley of the Sun (Phoenix) • Tucson | |||||||||
| Alternative Fuels | Arizona | Share of U.S. | Period | |||||||
| Alternative-Fueled Vehicles in Use | 26,862 | 4.5% | 2006 | |||||||
| Ethanol Plants | 1 | 0.7% | 2008 | |||||||
| Ethanol Plant Capacity | 55 million gal/year | 0.7% | 2008 | |||||||
| Ethanol Use in Gasohol | 13,251 thousand gal | 0.4% | 2004 | |||||||
| Electric Power Industry Emissions | Arizona | Share of U.S. | Period | |||||||
| Carbon Dioxide |
53,353,217 metric tons | 2.2% | 2006 | |||||||
| Sulfur Dioxide |
44,745 metric tons | 0.5% | 2006 | |||||||
| Nitrogen Oxide |
75,002 metric tons | 2.0% | 2006 | |||||||
| — = No data reported; NA = Not available; W = Withheld to avoid disclosure of individual company data. |
|
||||||||||||||||||||||||||||||||||||||||||||||||||||||||||||||||||||||||||||||||||||||||||||||||||||||||||||||||||||||||||||||||||||||||||||||||||||||||||||||