|
|
|||
State Energy Profile - ArkansasEnergy Information Administration - State Energy Profileshttp://tonto.eia.doe.gov/state |
||||||
|---|---|---|---|---|---|---|
|
||||||
|
Last Update: January 02, 2009
Next Update: January 08 , 2009 |
||||||
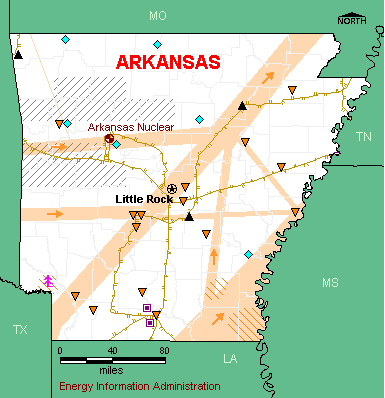
OverviewResources and ConsumptionArkansas has moderate energy resources. Substantial natural gas reserves are found in the Arkoma basin in western Arkansas and in the Gulf Coastal Plain in the south. Smaller oil reserves and coal deposits are also found in those regions. Several river basins, including the Lower Arkansas River, offer hydroelectric power potential. Areas of the State are also suitable for wind, wood, and wood waste power generation. Per capita energy use is high due in part to an energy-intensive industrial sector, which leads State energy consumption. PetroleumArkansas extracts small amounts of crude oil mostly from stripper wells that produce less than 10 barrels per day in the southern part of the Gulf Coastal Plain of south Arkansas. Arkansas has two refineries located in the same region. Petroleum products are delivered to consuming regions by barge via the Arkansas and Mississippi Rivers. The TEPPCO pipeline also supplies petroleum products from Texas and Louisiana. Arkansas is one of the few States in the Nation that allow the statewide use of conventional motor gasoline. (Most States require the use of special fuel blends in non-attainment areas.) Natural GasArkansas natural gas production typically accounts for about 1 percent of annual U.S. output. Most of the State’s natural gas production takes place in the Arkoma Basin, although several wells also operate in the Gulf Costal Plain. In addition to conventional production, companies are beginning to extract small amounts of natural gas from coalbed methane deposits in the Arkoma Basin. Several major natural gas pipelines from Texas, Louisiana, and Oklahoma pass through the State on the way to Midwest and Northeast markets. Industrial sector natural gas consumption in Arkansas has declined in recent years. Until 2001, the industrial sector accounted for more than half of the State’s natural gas consumption but this share had fallen to two-fifths by 2005. Almost one-half of Arkansas households use natural gas as their primary energy source for home heating. Coal, Electricity, and RenewablesCoal and nuclear power are the dominant energy sources used for electricity generation in Arkansas, although natural gas and hydroelectric power are also important energy sources. Coal-fired power plants account for about one-half of the electricity produced within the State, and these plants rely entirely on coal deliveries from Wyoming. The State’s only nuclear plant (the dual-unit Arkansas Nuclear One Plant in Russellville) typically generates more than one-fourth of the total electricity generated in the State. Hydroelectric power plants in the White River Basin in the north, along the Arkansas River in central Arkansas, and in the Ouachita River Basin in the south also contribute to electricity supply. About one-third of Arkansas households use electricity as their primary energy source for home heating. |
|
| Economy | ||||
| Population and Employment | Arkansas | U.S. Rank | Period | |||||||
| Population | 2.9 million | 32 |
2008 | |||||||
| Civilian Labor Force | 1.4 million | 32 |
2007 | |||||||
| Per Capita Personal Income | $30,060 | 49 |
2007 | |||||||
| Industry | Arkansas | U.S. Rank | Period | |||||||
| Gross Domestic Product by State | $95.4 billion | 34 | 2007 | |||||||
| Land in Farms | 14.5 million acres | 22 |
2002 | |||||||
| Market Value of Agricultural Products Sold | $5.0 billion | 13 |
2002 | |||||||
| Prices | ||||
| Petroleum | Arkansas | U.S. Avg. | Period | |||||||
| Domestic Crude Oil First Purchase |
$67.9/barrel
|
$73.22/barrel | Oct-08 | |||||||
| No. 2 Heating Oil, Residential | — | $3.168/gal | Oct-08 | |||||||
| Regular Motor Gasoline Sold Through Retail Outlets (Excluding Taxes) | $2.391/gal | $2.527/gal | Oct-08 | |||||||
| State Tax Rate on Motor Gasoline (other taxes may apply) |
$0.215/gal | $0.2159/gal | Aug-08 | |||||||
| No. 2 Diesel Fuel Sold Through Retail Outlets (Excluding Taxes) | — | $3.021/gal | Oct-08 | |||||||
| State Tax Rate on On-Highway Diesel (other taxes may apply) |
$0.225/gal | $0.2214/gal | Aug-08 | |||||||
| Natural Gas | Arkansas | U.S. Avg. | Period | |||||||
| Wellhead | $6.43/thousand cu ft | $6.40/thousand cu ft | 2006 | |||||||
| City Gate | $9.94/thousand cu ft | $7.88/thousand cu ft | Oct-08 | |||||||
| Residential | $18.57/thousand cu ft | $15.23/thousand cu ft | Oct-08 | |||||||
| Coal | Arkansas | U.S. Avg. | Period | |||||||
| Average Open Market Sales Price | W | $26.20/short ton | 2007 | |||||||
| Delivered to Electric Power Sector | $ 1.80/million Btu | $ 2.16 /million Btu | Sep-08 | |||||||
| Electricity | Arkansas | U.S. Avg. | Period | |||||||
| Residential | 10.17 cents/kWh | 11.94 cents/kWh | Sep-08 | |||||||
| Commercial | 8.10 cents/kWh | 10.77 cents/kWh | Sep-08 | |||||||
| Industrial | 6.27 cents/kWh | 7.36 cents/kWh | Sep-08 | |||||||
|
|||||||||||||||||||||||||
| Reserves | Arkansas | Share of U.S. | Period | ||||||||||||||||||||||
| Crude Oil | 31 million barrels | 0.1% | 2007 | ||||||||||||||||||||||
| Dry Natural Gas | 3,305 billion cu ft | 1.4% | 2007 | ||||||||||||||||||||||
| Natural Gas Liquids | 3 million barrels | 0.0% | 2007 | ||||||||||||||||||||||
| Recoverable Coal at Producing Mines | W | NA | 2007 | ||||||||||||||||||||||
| Rotary Rigs & Wells | Arkansas | Share of U.S. | Period | ||||||||||||||||||||||
| Rotary Rigs in Operation | 45 | 2.5% | 2007 | ||||||||||||||||||||||
| Crude Oil Producing Wells | 7,252 | 1.4% | 2007 | ||||||||||||||||||||||
| Natural Gas Producing Wells | 3,811 | 0.8% | 2006 | ||||||||||||||||||||||
| Production | Arkansas | Share of U.S. | Period | ||||||||||||||||||||||
| Total Energy | 480 trillion Btu | 0.7% | 2005 | ||||||||||||||||||||||
| Crude Oil | 517 thousand barrels | 0.4% | Aug-08 | ||||||||||||||||||||||
| Natural Gas - Marketed | 193,258 million cu ft | 1.0% | 2006 | ||||||||||||||||||||||
| Coal | 83 thousand short tons | NA | 2007 | ||||||||||||||||||||||
| Capacity | Arkansas | Share of U.S. | Period | ||||||||||||||||||||||
| Crude Oil Refinery Capacity (as of Jan. 1) | 77,500 barrels/calendar day | 0.4% | 2008 | ||||||||||||||||||||||
| Electric Power Industry Net Summer Capability | 14,507 MW | 1.5% | 2006 | ||||||||||||||||||||||
| Net Electricity Generation | Arkansas | Share of U.S. | Period | ||||||||||||||||||||||
| Total Net Electricity Generation | 4,358 thousand MWh | 1.3% | Sep-08 | ||||||||||||||||||||||
| Petroleum-Fired | 1 thousand MWh | 0.0% | Sep-08 | ||||||||||||||||||||||
| Natural Gas-Fired | 547 thousand MWh | 0.7% | Sep-08 | ||||||||||||||||||||||
| Coal-Fired | 2,009 thousand MWh | 1.2% | Sep-08 | ||||||||||||||||||||||
| Nuclear | 1,335 thousand MWh | 2.0% | Sep-08 | ||||||||||||||||||||||
| Hydroelectric | 328 thousand MWh | 2.0% | Sep-08 | ||||||||||||||||||||||
| Other Renewables | 129 thousand MWh | 1.6% | Sep-08 | ||||||||||||||||||||||
| Stocks | Arkansas | Share of U.S. | Period | ||||||||||||||||||||||
| Motor Gasoline (Excludes Pipelines) | 590 thousand barrels | 1.0% | Oct-08 | ||||||||||||||||||||||
| Distillate Fuel Oil (Excludes Pipelines) | 680 thousand barrels | 0.7% | Oct-08 | ||||||||||||||||||||||
| Natural Gas in Underground Storage | 14,259 million cu ft | 0.2% | Oct-08 | ||||||||||||||||||||||
| Petroleum Stocks at Electric Power Producers | 203 thousand barrels | 0.5 % | Sep-08 | ||||||||||||||||||||||
| Coal Stocks at Electric Power Producers | 2,420 thousand tons | 1.7% | Sep-08 | ||||||||||||||||||||||
| Production Facilities | Arkansas | ||||||||||||||||||||||||
| Major Coal Mines | None | ||||||||||||||||||||||||
| Petroleum Refineries | Cross Oil Refining & Marketing Inc (Smackover) • Lion Oil Co (El Dorado) | ||||||||||||||||||||||||
| Major Non-Nuclear Electricity Generating Plants | Union Power Partners LP (Union Power Partners LP) • Independence (Entergy Arkansas Inc) • White Bluff (Entergy Arkansas Inc) • Robert E Ritchie (Entergy Arkansas Inc) • Lake Catherine (Entergy Arkansas Inc) | ||||||||||||||||||||||||
| Nuclear Power Plants | Arkansas Nuclear One (Entergy Arkansas Inc) | ||||||||||||||||||||||||
| Distribution & Marketing | ||||
| Distribution Centers | Arkansas | |||||||||
| Oil Seaports/Oil Import Sites | None | |||||||||
| Natural Gas Market Centers | None | |||||||||
| Major Pipelines | Arkansas | |||||||||
| Crude Oil | Lion • Mid-Valley • Mobil. | |||||||||
| Petroleum Product | Razorback • Sun • TEPPCO. | |||||||||
| Liquefied Petroleum Gases | TEPPCO | |||||||||
| Interstate Natural Gas Pipelines | ANR Pipeline Co. • Centerpoint Energy Gas Transmission Co. • Mississippi River Transmission Corp. • Natural Gas Pipeline Co. of America • Tennessee Gas Pipeline Co. • Texas Eastern Transmission Corp. • Texas Gas Transmission Co. • Trunkline Gas Co. | |||||||||
| Fueling Stations | Arkansas | Share of U.S. | Period | |||||||
| Motor Gasoline | 2,754 | 1.7% | 2007 | |||||||
| Liquefied Petroleum Gases | 40 | 1.7% | 2007 | |||||||
| Compressed Natural Gas | 3 | 0.4% | 2007 | |||||||
| Ethanol | 4 | 0.3% | 2007 | |||||||
| Other Alternative Fuels | 1 | 0.1% | 2007 | |||||||
| Consumption | ||||
| per Capita | Arkansas | U.S. Rank | Period | |||||||
| Total Energy | 407 million Btu | 13 | 2006 | |||||||
| by Source | Arkansas | Share of U.S. | Period | |||||||
| Total Energy | 1,145 trillion Btu | 1.2% | 2006 | |||||||
| Total Petroleum | 70,776 thousand barrels | 0.9% | 2006 | |||||||
| Motor Gasoline | 34,560 thousand barrels | 1.0% | 2006 | |||||||
| Distillate Fuel | 23,624 thousand barrels | 1.6% | 2006 | |||||||
| Liquefied Petroleum Gases | 2,784 thousand barrels | 0.4% | 2006 | |||||||
| Jet Fuel | 1,183 thousand barrels | 0.2% | 2006 | |||||||
| Natural Gas | 233,640 million cu ft | 1.0% | 2006 | |||||||
| Coal | 14,979 thousand short tons | 1.3% | 2006 | |||||||
| by End-Use Sector | Arkansas | Share of U.S. | Period | |||||||
| Residential | 225,114 billion Btu | 1.1% | 2006 | |||||||
| Commercial | 160,103 billion Btu | 0.9% | 2006 | |||||||
| Industrial | 469,617 billion Btu | 1.5% | 2006 | |||||||
| Transportation | 289,676 billion Btu | 1.0% | 2006 | |||||||
| for Electricity Generation | Arkansas | Share of U.S. | Period | |||||||
| Petroleum | 1 thousand barrels | 0.0% | Sep-08 | |||||||
| Natural Gas | 5,258 million cu ft | 0.8% | Sep-08 | |||||||
| Coal | 1,244 thousand short tons | 1.4% | Sep-08 | |||||||
| for Home Heating (share of households) | Arkansas | U.S. Avg. | Period | |||||||
| Natural Gas | 49% | 51.2% | 2000 | |||||||
| Fuel Oil | 0% | 9.0% | 2000 | |||||||
| Electricity | 33% | 30.3% | 2000 | |||||||
| Liquefied Petroleum Gases | 14% | 6.5% | 2000 | |||||||
| Other/None | 4% | 1.8% | 2000 | |||||||
| Environment | ||||
| Special Programs | Arkansas | |||||||||
| Clean Cities Coalitions | Central Arkansas | |||||||||
| Alternative Fuels | Arkansas | Share of U.S. | Period | |||||||
| Alternative-Fueled Vehicles in Use | 2,817 | 0.5% | 2006 | |||||||
| Ethanol Plants | 0 | 0.0% | 2008 | |||||||
| Ethanol Plant Capacity | 0 million gal/year | 0.0% | 2008 | |||||||
| Ethanol Use in Gasohol | 0 thousand gal | 0.0% | 2004 | |||||||
| Electric Power Industry Emissions | Arkansas | Share of U.S. | Period | |||||||
| Carbon Dioxide |
28,494,445 metric tons | 1.2% | 2006 | |||||||
| Sulfur Dioxide |
81,969 metric tons | 0.9% | 2006 | |||||||
| Nitrogen Oxide |
38,228 metric tons | 1.0% | 2006 | |||||||
| — = No data reported; NA = Not available; W = Withheld to avoid disclosure of individual company data. |
|
||||||||||||||||||||||||||||||||||||||||||||||||||||||||||||||||||||||||||||||||||||||||||||||||||||||||||||||||||||||||||||||||||||||||||||||||||||||||||||||