|
|
|||
State Energy Profile - OregonEnergy Information Administration - State Energy Profileshttp://tonto.eia.doe.gov/state |
||||||
|---|---|---|---|---|---|---|
|
||||||
|
Last Update: January 02, 2009
Next Update: January 08 , 2009 |
||||||
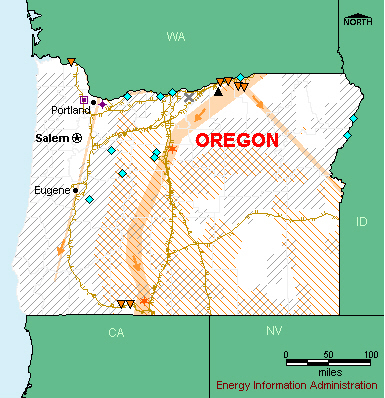
OverviewResources and ConsumptionOregon has few conventional energy resources but is rich in renewable energy potential. The Columbia River in the north and several smaller waterways flowing from the Cascade Mountains give Oregon some of the highest hydroelectric power potential in the United States. Much of the State has considerable wind power potential. The geologically active basin and range country in southeastern Oregon, as well as the Cascades in western Oregon, are promising sites for geothermal energy development. Oregon’s total energy consumption is low, although the State is a leader in the energy-intensive forest products industry. The transportation sector is the leading energy-consuming sector in Oregon, followed closely by the industrial and residential sectors. PetroleumOregon’s only refinery, located in the Portland area, primarily produces asphalt and vacuum gas oil. The State receives petroleum-based transportation and heating fuels from Washington and northern California. Tanker trucks from California supply southern Oregon, while ships and barges deliver additional product from San Francisco to the Portland area. The use of oxygenated motor gasoline is required in the Klamath County and Medford areas during the winter months. Natural GasOregon receives its natural gas supply by pipeline: the Northwest Pipeline Corp. system supplies the Portland area and western markets, while the Gas Transmission Northwest system line serves the east. Although Oregon has two market hubs along the Gas Transmission Northwest line, they serve primarily California markets. In Oregon, natural gas is principally used for electricity generation, with the industrial and residential sectors, respectively, as the next largest consumers. Over one-third of Oregon households use natural gas as their primary energy source for home heating. Liquefied natural gas (LNG) import facilities have been proposed in Oregon to help meet demand for the fuel. Coal, Electricity, and RenewablesAccounting for more than one-half of State electricity generation, hydroelectric power dominates the electricity market in Oregon. Natural gas-fired plants supply around one-third of the market, with coal-fired generation supplying most of the rest. Oregon is one of the leading hydroelectric power producers in the Nation. Oregon’s four largest electricity generation facilities, all located on the Columbia River, are hydroelectric generation plants. Smaller hydroelectric plants generate power along several rivers flowing from the Cascade Mountains. Natural gas-fired power plants are located along major gas transmission lines. The Boardman plant in the north central part of the State supplies virtually all of Oregon’s coal-fired generation. Oregon has several small operating wind power facilities, generates some electricity from wood and wood waste, and produces smaller amounts of electricity from landfill gas. Major transmission lines connect Oregon’s electricity grid to California and Washington State, allowing for large interstate energy transfers. One of these transmission systems is the Western USA interconnection, which runs from northern Oregon to southern California. The system, also known as the Pacific Intertie, is the largest single electricity transmission program in the United States. Although the Pacific Intertie was originally designed to transmit electricity south during California’s peak summer demand season, flow is sometimes reversed overnight and has occasionally been reversed during periods of reduced hydroelectric generation in the Northwest. Nearly one-half of Oregon households use electricity as their main source of energy for home heating. |
|
| Economy | ||||
| Population and Employment | Oregon | U.S. Rank | Period | |||||||
| Population | 3.7 million | 27 |
2007 | |||||||
| Civilian Labor Force | 2.0 million | 26 |
2007 | |||||||
| Per Capita Personal Income | $34,784 | 31 |
2007 | |||||||
| Industry | Oregon | U.S. Rank | Period | |||||||
| Gross Domestic Product by State | $158.2 billion | 26 | 2007 | |||||||
| Land in Farms | 17.1 million acres | 17 |
2002 | |||||||
| Market Value of Agricultural Products Sold | $3.2 billion | 25 |
2002 | |||||||
| Prices | ||||
| Petroleum | Oregon | U.S. Avg. | Period | |||||||
| Domestic Crude Oil First Purchase | — | $98.5/barrel | Sep-08 | |||||||
| No. 2 Heating Oil, Residential | $3.535/gal | $3.666/gal | Sep-08 | |||||||
| Regular Motor Gasoline Sold Through Retail Outlets (Excluding Taxes) | $3.244/gal | $3.207/gal | Sep-08 | |||||||
| State Tax Rate on Motor Gasoline (other taxes may apply) |
$0.24/gal | $0.2159/gal | Aug-08 | |||||||
| No. 2 Diesel Fuel Sold Through Retail Outlets (Excluding Taxes) | $3.491/gal | $3.484/gal | Sep-08 | |||||||
| State Tax Rate on On-Highway Diesel (other taxes may apply) |
$0.24/gal | $0.2214/gal | Aug-08 | |||||||
| Natural Gas | Oregon | U.S. Avg. | Period | |||||||
| Wellhead | $4.42/thousand cu ft | $6.40/thousand cu ft | 2006 | |||||||
| City Gate | $9.42/thousand cu ft | $8.96/thousand cu ft | Sep-08 | |||||||
| Residential | $16.46/thousand cu ft | $17.94/thousand cu ft | Sep-08 | |||||||
| Coal | Oregon | U.S. Avg. | Period | |||||||
| Average Open Market Sales Price | — | $26.20/short ton | 2007 | |||||||
| Delivered to Electric Power Sector | $ 1.44/million Btu | $ 2.16 /million Btu | Sep-08 | |||||||
| Electricity | Oregon | U.S. Avg. | Period | |||||||
| Residential | 8.69 cents/kWh | 11.94 cents/kWh | Sep-08 | |||||||
| Commercial | 7.27 cents/kWh | 10.77 cents/kWh | Sep-08 | |||||||
| Industrial | 5.43 cents/kWh | 7.36 cents/kWh | Sep-08 | |||||||
|
|||||||||||||||||||||||||
| Reserves | Oregon | Share of U.S. | Period | ||||||||||||||||||||||
| Crude Oil | — | — | 2007 | ||||||||||||||||||||||
| Dry Natural Gas | — | — | 2007 | ||||||||||||||||||||||
| Natural Gas Liquids | — | — | 2007 | ||||||||||||||||||||||
| Recoverable Coal at Producing Mines | — | — | 2007 | ||||||||||||||||||||||
| Rotary Rigs & Wells | Oregon | Share of U.S. | Period | ||||||||||||||||||||||
| Rotary Rigs in Operation | 0 | 0.0% | 2007 | ||||||||||||||||||||||
| Crude Oil Producing Wells | 0 | 0.0% | 2007 | ||||||||||||||||||||||
| Natural Gas Producing Wells | 14 | 0.0% | 2006 | ||||||||||||||||||||||
| Production | Oregon | Share of U.S. | Period | ||||||||||||||||||||||
| Total Energy | 373 trillion Btu | 0.5% | 2005 | ||||||||||||||||||||||
| Crude Oil | — | — | Jul-08 | ||||||||||||||||||||||
| Natural Gas - Marketed | 621 million cu ft | 0.0% | 2006 | ||||||||||||||||||||||
| Coal | — | — | 2007 | ||||||||||||||||||||||
| Capacity | Oregon | Share of U.S. | Period | ||||||||||||||||||||||
| Crude Oil Refinery Capacity (as of Jan. 1) | 0 barrels/calendar day | 0.0% | 2008 | ||||||||||||||||||||||
| Electric Power Industry Net Summer Capability | 12,333 MW | 1.3% | 2006 | ||||||||||||||||||||||
| Net Electricity Generation | Oregon | Share of U.S. | Period | ||||||||||||||||||||||
| Total Net Electricity Generation | 4,185 thousand MWh | 1.2% | Sep-08 | ||||||||||||||||||||||
| Petroleum-Fired | 1 thousand MWh | 0.0% | Sep-08 | ||||||||||||||||||||||
| Natural Gas-Fired | 1,627 thousand MWh | 2.1% | Sep-08 | ||||||||||||||||||||||
| Coal-Fired | 351 thousand MWh | 0.2% | Sep-08 | ||||||||||||||||||||||
| Nuclear | — | — | Sep-08 | ||||||||||||||||||||||
| Hydroelectric | 2,001 thousand MWh | 12.1% | Sep-08 | ||||||||||||||||||||||
| Other Renewables | 202 thousand MWh | 2.5% | Sep-08 | ||||||||||||||||||||||
| Stocks | Oregon | Share of U.S. | Period | ||||||||||||||||||||||
| Motor Gasoline (Excludes Pipelines) | 673 thousand barrels | 1.1% | Sep-08 | ||||||||||||||||||||||
| Distillate Fuel Oil (Excludes Pipelines) | 732 thousand barrels | 0.8% | Sep-08 | ||||||||||||||||||||||
| Natural Gas in Underground Storage | 27,360 million cu ft | 0.4% | Sep-08 | ||||||||||||||||||||||
| Petroleum Stocks at Electric Power Producers | W | W | Sep-08 | ||||||||||||||||||||||
| Coal Stocks at Electric Power Producers | W | W | Sep-08 | ||||||||||||||||||||||
| Production Facilities | Oregon | ||||||||||||||||||||||||
| Major Coal Mines | None | ||||||||||||||||||||||||
| Petroleum Refineries | Paramount Petroleum Corporation (Portland) | ||||||||||||||||||||||||
| Major Non-Nuclear Electricity Generating Plants | John Day (USCE-North Pacific Division) • The Dalles (USCE-North Pacific Division) • Bonneville (USCE-North Pacific Division) • McNary (USCE-North Pacific Division) • Hermiston Power Partnership (Hermiston Power Partnership) | ||||||||||||||||||||||||
| Nuclear Power Plants | None | ||||||||||||||||||||||||
| Distribution & Marketing | ||||
| Distribution Centers | Oregon | |||||||||
| Oil Seaports/Oil Import Sites | Portland | |||||||||
| Natural Gas Market Centers | Malin Center (Market Hub Services) • Stanfield Center (Market Hub Services) | |||||||||
| Major Pipelines | Oregon | |||||||||
| Crude Oil | Chevron • Santa Fe Pacific. | |||||||||
| Petroleum Product | None | |||||||||
| Liquefied Petroleum Gases | None | |||||||||
| Interstate Natural Gas Pipelines | Northwest Pipeline Corp. • Tuscarora Pipeline Co. | |||||||||
| Fueling Stations | Oregon | Share of U.S. | Period | |||||||
| Motor Gasoline | 1,696 | 1.0% | 2007 | |||||||
| Liquefied Petroleum Gases | 31 | 1.4% | 2007 | |||||||
| Compressed Natural Gas | 13 | 1.6% | 2007 | |||||||
| Ethanol | 7 | 0.5% | 2007 | |||||||
| Other Alternative Fuels | 43 | 3.7% | 2007 | |||||||
| Consumption | ||||
| per Capita | Oregon | U.S. Rank | Period | |||||||
| Total Energy | 301 million Btu | 35 | 2006 | |||||||
| by Source | Oregon | Share of U.S. | Period | |||||||
| Total Energy | 1,112 trillion Btu | 1.1% | 2006 | |||||||
| Total Petroleum | 70,577 thousand barrels | 0.9% | 2006 | |||||||
| Motor Gasoline | 37,956 thousand barrels | 1.1% | 2006 | |||||||
| Distillate Fuel | 18,586 thousand barrels | 1.2% | 2006 | |||||||
| Liquefied Petroleum Gases | 1,150 thousand barrels | 0.2% | 2006 | |||||||
| Jet Fuel | 5,764 thousand barrels | 1.0% | 2006 | |||||||
| Natural Gas | 222,643 million cu ft | 1.0% | 2006 | |||||||
| Coal | W | W | 2006 | |||||||
| by End-Use Sector | Oregon | Share of U.S. | Period | |||||||
| Residential | 270,086 billion Btu | 1.3% | 2006 | |||||||
| Commercial | 209,204 billion Btu | 1.2% | 2006 | |||||||
| Industrial | 293,072 billion Btu | 0.9% | 2006 | |||||||
| Transportation | 339,428 billion Btu | 1.2% | 2006 | |||||||
| for Electricity Generation | Oregon | Share of U.S. | Period | |||||||
| Petroleum | 1 thousand barrels | 0.0% | Sep-08 | |||||||
| Natural Gas | 11,697 million cu ft | 1.9% | Sep-08 | |||||||
| Coal | 204 thousand short tons | 0.2% | Sep-08 | |||||||
| for Home Heating (share of households) | Oregon | U.S. Avg. | Period | |||||||
| Natural Gas | 35% | 51.2% | 2000 | |||||||
| Fuel Oil | 7% | 9.0% | 2000 | |||||||
| Electricity | 49% | 30.3% | 2000 | |||||||
| Liquefied Petroleum Gases | 2% | 6.5% | 2000 | |||||||
| Other/None | 7% | 1.8% | 2000 | |||||||
| Environment | ||||
| Special Programs | Oregon | |||||||||
| Clean Cities Coalitions | Columbia-Willamette (formerly Portland) • Rogue Valley | |||||||||
| Alternative Fuels | Oregon | Share of U.S. | Period | |||||||
| Alternative-Fueled Vehicles in Use | 8,014 | 1.4% | 2006 | |||||||
| Ethanol Plants | 0 | 0.0% | 2008 | |||||||
| Ethanol Plant Capacity | 0 million gal/year | 0.0% | 2008 | |||||||
| Ethanol Use in Gasohol | 28,927 thousand gal | 0.8% | 2004 | |||||||
| Electric Power Industry Emissions | Oregon | Share of U.S. | Period | |||||||
| Carbon Dioxide |
7,087,813 metric tons | 0.3% | 2006 | |||||||
| Sulfur Dioxide |
11,256 metric tons | 0.1% | 2006 | |||||||
| Nitrogen Oxide |
12,394 metric tons | 0.3% | 2006 | |||||||
| — = No data reported; NA = Not available; W = Withheld to avoid disclosure of individual company data. |
|
||||||||||||||||||||||||||||||||||||||||||||||||||||||||||||||||||||||||||||||||||||||||||||||||||||||||||||||||||||||||||||||||||||||||||||||||||||||||||||||