|
|
|||
State Energy Profile - WyomingEnergy Information Administration - State Energy Profileshttp://tonto.eia.doe.gov/state |
||||||
|---|---|---|---|---|---|---|
|
||||||
|
Last Update: January 02, 2009
Next Update: January 08 , 2009 |
||||||
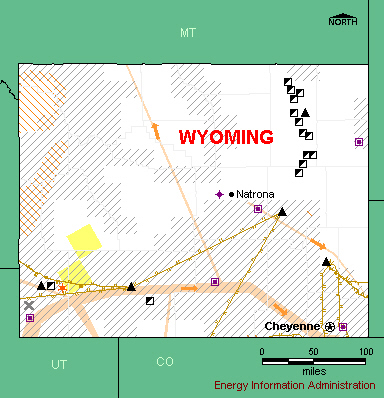
OverviewResources and ConsumptionWyoming’s major geologic basins contain some of the largest fossil fuel deposits in the United States. Wyoming’s estimated recoverable coal reserves are second only to Montana’s, its dry natural gas reserves are second only to those in Texas, and its crude oil reserves are among the largest in the Nation. Wyoming has over a dozen of the Nation’s largest oil and gas fields, including the Pinedale and Jonah natural gas fields, which rank among the top 10 in the country. Wyoming has substantial wind power potential. The Southern Wyoming Corridor, where a gap in the Rocky Mountains channels strong winds across the plains, is ideally suited for wind power development. Wind power resources also exist in the northwestern part of the State. Although Wyoming’s aggregate energy demand is low, per capita energy consumption is the second highest in the Nation due to an energy-intensive economy that is dependant on fossil fuel extraction, processing, and transportation. The industrial sector, which includes Wyoming’s mining, oil, and gas industries, is the State’s leading consumer of energy. PetroleumWyoming typically accounts for roughly 3 percent of annual U.S. oil production. The State is a transportation crossroads for Canadian crude oil imports and local Rocky Mountain production flowing to U.S. Midwest and Mountain markets. The State has five oil refineries, which lie in the southern and eastern parts of the State. Wyoming’s total petroleum consumption is low, and refineries deliver much of their product to markets in neighboring States. Wyoming is one of the few States in the Nation that allow the statewide use of conventional motor gasoline. (Most States require the use of specific gasoline blends in non-attainment areas due to air-quality considerations.) Although its proven crude oil reserves account for only about 3 percent of the U.S. total, Wyoming has enormous deposits of oil shale rock, known as marlstone, which can be converted into crude oil through destructive distillation. The Green River Formation, a group of basins in Colorado, Wyoming, and Utah, contains the largest known oil shale deposits in the world. Wyoming’s oil shale deposits, concentrated in the Green River and Washakie Basins in the southwestern part of the State, contain an estimated 300 billion barrels of oil, equal to about one-fourth of the world’s proven oil reserves. Although this natural resource holds tremendous promise, oil shale development remains speculative and faces several major obstacles involving technological feasibility, economic viability, resource ownership, and environmental considerations. Wyoming’s oil shale deposits are less favorable for commercial extraction than those in Utah and Colorado because they are generally situated in thinner, less continuous layers. Natural GasWyoming is one of the top natural gas-producing States in the Nation and typically accounts for almost one-tenth of U.S. natural gas production. Drilling activities take place throughout the State, but most of Wyoming’s production comes from fields in the Greater Green River Basin. Recovery of coalbed methane from coal seams in the Powder River Basin has grown rapidly since the late 1990s and now accounts for about one-fifth of State natural gas production. Wyoming is the third leading coalbed methane producer in the United States, after Colorado and New Mexico. The full potential of Powder River Basin coalbed methane resources has not been tapped due to the basin’s few pipelines and rugged terrain. The Bureau of Land Management approved new drilling in the basin in 2003, which may encourage increased production from that area. Unlike other major U.S. natural gas producing regions, Wyoming’s natural gas production is expanding. However, State consumption is low and Wyoming generally consumes less than one-tenth of the natural gas it produces. Major pipeline systems deliver the majority of Wyoming supply to markets in the Midwest and California, and natural gas producers have proposed a new pipeline to ease transportation constraints and help move Wyoming’s increasing output to the Midwest. The proposed system, known as the Rockies Express Pipeline and scheduled to be in service by January 2008, will originate in northwestern Colorado and add supply in Wyoming’s Greater Green River Basin for delivery to Midwest markets. Coal, Electricity, and RenewablesThe Powder River Basin in northeastern Wyoming is the largest coal-producing region in the Nation, accounting for nearly two-fifths of all coal mined in the United States. Power River Basin coal seams are thick and facilitate surface mining, making extraction easy and efficient. As a result, the price of Powder River Basin coal at the mine mouth is less than that of coal produced elsewhere in the country. Powder River Basin coal also has lower sulfur content than other coal varieties, making it attractive for electricity generators that must comply with strict emission standards. More than thirty States receive coal from Wyoming, and several Midwestern and Southern States are highly or entirely dependent on Wyoming supply. Two railroads, operating the Powder River Basin Joint Line, move coal out of the Powder River Basin. In May 2005, three train derailments severely damaged the Joint Line, causing the railroads to curtail promised deliveries to electric utilities in several States. The affected utilities were forced to either buy more expensive coal supplies from other sources or reduce coal use by using other, more expensive fuels. A second railroad line serving the Powder River Basin has been proposed to provide an alternative coal transportation route and alleviate bottlenecks on the Joint Line. Coal-fired power plants dominate Wyoming electricity generation. Small hydroelectric facilities and a growing number of wind farms also contribute to the electric power grid. Although most of Wyoming’s wind power facilities are in the southeastern part of the State, its largest wind facility is situated in the southwest corner of the State. State electricity demand is low, and Wyoming exports electricity to neighboring States. Electricity transfers may reach as far as California in the future. In April 2005, four western State governors agreed to develop a 1,300-mile high-capacity power line from Wyoming to California that would allow as much as 12 thousand megawatts of electricity to flow from the energy-rich Rocky Mountain region to high-demand markets in California. |
|
| Economy | ||||
| Population and Employment | Wyoming | U.S. Rank | Period | |||||||
| Population | 0.5 million | 51 |
2007 | |||||||
| Civilian Labor Force | 0.3 million | 51 |
2007 | |||||||
| Per Capita Personal Income | $43,226 | 7 |
2007 | |||||||
| Industry | Wyoming | U.S. Rank | Period | |||||||
| Gross Domestic Product by State | $31.5 billion | 49 | 2007 | |||||||
| Land in Farms | 34.4 million acres | 8 |
2002 | |||||||
| Market Value of Agricultural Products Sold | $0.9 billion | 38 |
2002 | |||||||
| Prices | ||||
| Petroleum | Wyoming | U.S. Avg. | Period | |||||||
| Domestic Crude Oil First Purchase |
$88.61/barrel
|
$98.5/barrel | Sep-08 | |||||||
| No. 2 Heating Oil, Residential | — | $3.666/gal | Sep-08 | |||||||
| Regular Motor Gasoline Sold Through Retail Outlets (Excluding Taxes) | $3.311/gal | $3.207/gal | Sep-08 | |||||||
| State Tax Rate on Motor Gasoline (other taxes may apply) |
$0.14/gal | $0.2159/gal | Aug-08 | |||||||
| No. 2 Diesel Fuel Sold Through Retail Outlets (Excluding Taxes) | — | $3.484/gal | Sep-08 | |||||||
| State Tax Rate on On-Highway Diesel (other taxes may apply) |
$0.14/gal | $0.2214/gal | Aug-08 | |||||||
| Natural Gas | Wyoming | U.S. Avg. | Period | |||||||
| Wellhead | $5.85/thousand cu ft | $6.40/thousand cu ft | 2006 | |||||||
| City Gate | $4.51/thousand cu ft | $8.96/thousand cu ft | Sep-08 | |||||||
| Residential | $16.09/thousand cu ft | $17.94/thousand cu ft | Sep-08 | |||||||
| Coal | Wyoming | U.S. Avg. | Period | |||||||
| Average Open Market Sales Price | $9.67/short ton | $26.20/short ton | 2007 | |||||||
| Delivered to Electric Power Sector | W | $ 2.16 /million Btu | Sep-08 | |||||||
| Electricity | Wyoming | U.S. Avg. | Period | |||||||
| Residential | 8.84 cents/kWh | 11.94 cents/kWh | Sep-08 | |||||||
| Commercial | 6.89 cents/kWh | 10.77 cents/kWh | Sep-08 | |||||||
| Industrial | 4.50 cents/kWh | 7.36 cents/kWh | Sep-08 | |||||||
|
|||||||||||||||||||||||||
| Reserves | Wyoming | Share of U.S. | Period | ||||||||||||||||||||||
| Crude Oil | 690 million barrels | 3.2% | 2007 | ||||||||||||||||||||||
| Dry Natural Gas | 29,710 billion cu ft | 12.5% | 2007 | ||||||||||||||||||||||
| Natural Gas Liquids | — | — | 2007 | ||||||||||||||||||||||
| Recoverable Coal at Producing Mines | 7,330 million short tons | 38.7 % | 2007 | ||||||||||||||||||||||
| Rotary Rigs & Wells | Wyoming | Share of U.S. | Period | ||||||||||||||||||||||
| Rotary Rigs in Operation | 74 | 4.2% | 2007 | ||||||||||||||||||||||
| Crude Oil Producing Wells | 6,620 | 1.3% | 2007 | ||||||||||||||||||||||
| Natural Gas Producing Wells | 25,052 | 5.6% | 2006 | ||||||||||||||||||||||
| Production | Wyoming | Share of U.S. | Period | ||||||||||||||||||||||
| Total Energy | 9,154 trillion Btu | 13.2% | 2005 | ||||||||||||||||||||||
| Crude Oil | 4,586 thousand barrels | 3.9% | Jul-08 | ||||||||||||||||||||||
| Natural Gas - Marketed | 1,816,201 million cu ft | 9.4% | 2006 | ||||||||||||||||||||||
| Coal | 453,568 thousand short tons | NA | 2007 | ||||||||||||||||||||||
| Capacity | Wyoming | Share of U.S. | Period | ||||||||||||||||||||||
| Crude Oil Refinery Capacity (as of Jan. 1) | 154,500 barrels/calendar day | 0.9% | 2008 | ||||||||||||||||||||||
| Electric Power Industry Net Summer Capability | 6,707 MW | 0.7% | 2006 | ||||||||||||||||||||||
| Net Electricity Generation | Wyoming | Share of U.S. | Period | ||||||||||||||||||||||
| Total Net Electricity Generation | 3,866 thousand MWh | 1.1% | Sep-08 | ||||||||||||||||||||||
| Petroleum-Fired | 1 thousand MWh | 0.0% | Sep-08 | ||||||||||||||||||||||
| Natural Gas-Fired | 34 thousand MWh | 0.0% | Sep-08 | ||||||||||||||||||||||
| Coal-Fired | 3,722 thousand MWh | 2.3% | Sep-08 | ||||||||||||||||||||||
| Nuclear | — | — | Sep-08 | ||||||||||||||||||||||
| Hydroelectric | 58 thousand MWh | 0.3% | Sep-08 | ||||||||||||||||||||||
| Other Renewables | 39 thousand MWh | 0.5% | Sep-08 | ||||||||||||||||||||||
| Stocks | Wyoming | Share of U.S. | Period | ||||||||||||||||||||||
| Motor Gasoline (Excludes Pipelines) | 717 thousand barrels | 1.2% | Sep-08 | ||||||||||||||||||||||
| Distillate Fuel Oil (Excludes Pipelines) | 395 thousand barrels | 0.4% | Sep-08 | ||||||||||||||||||||||
| Natural Gas in Underground Storage | 93,706 million cu ft | 1.3% | Sep-08 | ||||||||||||||||||||||
| Petroleum Stocks at Electric Power Producers | 38 thousand barrels | 0.1 % | Sep-08 | ||||||||||||||||||||||
| Coal Stocks at Electric Power Producers | 3,601 thousand tons | 2.5% | Sep-08 | ||||||||||||||||||||||
| Production Facilities | Wyoming | ||||||||||||||||||||||||
| Major Coal Mines | Black Thunder/Thunder Basin Coal Co. LLC • North Antelope Rochelle Complex/Powder River Coal Co. • Cordero Mine/Cordero Mining Co. • Jacobs Ranch Mine/Jacobs Ranch Coal Co. • Caballo Mine/Caballo Coal Co. • Antelope Coal Mines/Antelope Coal Co. • Eagle Butte Mine/Rag Coal West Inc. • Buckskin Mine/Triton Coal Co. • Belle Ayr Mine/Foundation Coal West Inc. • Rawhide Mine/Caballo Coal Co. • Wyodak/Wyodak Resources Development Co. • Kemmerer Mine/The Pittsburg & Midway Coal Mining Co. • Dry Fork Mine/Dry Fork Coal Co. | ||||||||||||||||||||||||
| Petroleum Refineries | Frontier Refining Inc (Cheyenne) • Little America Refining Co (Evansville) • Silver Eagle Refining (Evanston) • Sinclair Oil Corp (Sinclair) • Wyoming Refining Co (Newcastle) | ||||||||||||||||||||||||
| Major Non-Nuclear Electricity Generating Plants | Jim Bridger (PacifiCorp) • Laramie River Station (Basin Electric Power Coop) • Dave Johnston (PacifiCorp) • Naughton (PacifiCorp) • Wyodak (PacifiCorp) | ||||||||||||||||||||||||
| Nuclear Power Plants | None | ||||||||||||||||||||||||
| Distribution & Marketing | ||||
| Distribution Centers | Wyoming | |||||||||
| Oil Seaports/Oil Import Sites | Natrona Airport | |||||||||
| Natural Gas Market Centers | Opal (Production Hub) | |||||||||
| Major Pipelines | Wyoming | |||||||||
| Crude Oil | Amoco • Belle Fourche • Butte • Conoco • Express • Frontier • Platte • Mobil • Prima • Sinclair • Wyoming. | |||||||||
| Petroleum Product | Conoco • Kaneb • Pioneer • Sinclair • Wyoming Refining • Phillips • MAPCO. | |||||||||
| Liquefied Petroleum Gases | Phillips • MAPCO. | |||||||||
| Interstate Natural Gas Pipelines | Colorado Interstate Gas • Kern River Gas Transmission Co. • KM Interstate Gas Co. • Northwest Pipeline Corp. • Panhandle Eastern Pipeline Co. • Questar Pipeline Co. • Southern Star Central Gas Pipeline Co. • Trailblazer Pipeline Co. • Williston Basin Pipeline Co. | |||||||||
| Fueling Stations | Wyoming | Share of U.S. | Period | |||||||
| Motor Gasoline | 573 | 0.3% | 2007 | |||||||
| Liquefied Petroleum Gases | 31 | 1.4% | 2007 | |||||||
| Compressed Natural Gas | 8 | 1.0% | 2007 | |||||||
| Ethanol | 5 | 0.4% | 2007 | |||||||
| Other Alternative Fuels | 14 | 1.2% | 2007 | |||||||
| Consumption | ||||
| per Capita | Wyoming | U.S. Rank | Period | |||||||
| Total Energy | 938 million Btu | 2 | 2006 | |||||||
| by Source | Wyoming | Share of U.S. | Period | |||||||
| Total Energy | 481 trillion Btu | 0.5% | 2006 | |||||||
| Total Petroleum | 31,030 thousand barrels | 0.4% | 2006 | |||||||
| Motor Gasoline | 8,329 thousand barrels | 0.2% | 2006 | |||||||
| Distillate Fuel | 16,238 thousand barrels | 1.1% | 2006 | |||||||
| Liquefied Petroleum Gases | 1,257 thousand barrels | 0.2% | 2006 | |||||||
| Jet Fuel | 292 thousand barrels | 0.0% | 2006 | |||||||
| Natural Gas | 107,363 million cu ft | 0.5% | 2006 | |||||||
| Coal | 27,906 thousand short tons | 2.5% | 2006 | |||||||
| by End-Use Sector | Wyoming | Share of U.S. | Period | |||||||
| Residential | 42,120 billion Btu | 0.2% | 2006 | |||||||
| Commercial | 58,714 billion Btu | 0.3% | 2006 | |||||||
| Industrial | 257,124 billion Btu | 0.8% | 2006 | |||||||
| Transportation | 122,936 billion Btu | 0.4% | 2006 | |||||||
| for Electricity Generation | Wyoming | Share of U.S. | Period | |||||||
| Petroleum | 3 thousand barrels | 0.1% | Sep-08 | |||||||
| Natural Gas | 223 million cu ft | 0.0% | Sep-08 | |||||||
| Coal | 2,342 thousand short tons | 2.7% | Sep-08 | |||||||
| for Home Heating (share of households) | Wyoming | U.S. Avg. | Period | |||||||
| Natural Gas | 64% | 51.2% | 2000 | |||||||
| Fuel Oil | 0% | 9.0% | 2000 | |||||||
| Electricity | 19% | 30.3% | 2000 | |||||||
| Liquefied Petroleum Gases | 11% | 6.5% | 2000 | |||||||
| Other/None | 6% | 1.8% | 2000 | |||||||
| Environment | ||||
| Special Programs | Wyoming | |||||||||
| Clean Cities Coalitions | Greater Yellowstone-Teton Clean Cities National Park | |||||||||
| Alternative Fuels | Wyoming | Share of U.S. | Period | |||||||
| Alternative-Fueled Vehicles in Use | 2,045 | 0.3% | 2006 | |||||||
| Ethanol Plants | 1 | 0.7% | 2008 | |||||||
| Ethanol Plant Capacity | 5 million gal/year | 0.1% | 2008 | |||||||
| Ethanol Use in Gasohol | 0 thousand gal | 0.0% | 2004 | |||||||
| Electric Power Industry Emissions | Wyoming | Share of U.S. | Period | |||||||
| Carbon Dioxide |
45,215,552 metric tons | 1.8% | 2006 | |||||||
| Sulfur Dioxide |
83,944 metric tons | 0.9% | 2006 | |||||||
| Nitrogen Oxide |
81,682 metric tons | 2.1% | 2006 | |||||||
| — = No data reported; NA = Not available; W = Withheld to avoid disclosure of individual company data. |
|
||||||||||||||||||||||||||||||||||||||||||||||||||||||||||||||||||||||||||||||||||||||||||||||||||||||||||||||||||||||||||||||||||||||||||||||||||||||||||||||