2004 Surveillance Slides
This is an archived document. The links
and content are no longer being updated.
Return to 2004 Surveillance Slides
Main Menu
Primary MDR TB
United States, 1993–2004
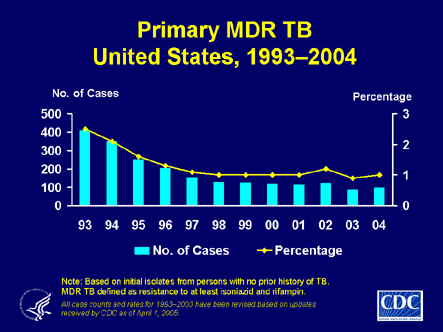 |
| Slide 20. Primary MDR TB, United States, 1993–2004.
This graph focuses on trends in primary MDR TB (based on initial
isolates from persons with no prior history of TB) in the United
States from 1993 through 2004. The number
of MDR TB cases, represented by bars, steadily declined from 410
in 1993 to 115 in 2001, increased to 126 in 2002, decreased to 89
in 2003, and once again increased to 101 cases in 2004. Primary
MDR TB, shown by the line, decreased from 2.5% in 1993 to 1.0% each
year during 1998–2001, increased to 1.2% in 2002, decreased to 0.9%
in 2003, and increased to 1.0% in 2004. |


Back to 2004 Surveillance Slides Main
Page |
Last Reviewed: 05/18/2008
Content Source: Division of Tuberculosis Elimination
National Center for HIV/AIDS, Viral Hepatitis, STD, and TB Prevention
Back to Top of Page
|
You will need Adobe Acrobat™ Reader
v5.0 or higher to read pages that are in PDF format. Download the Adobe Acrobat™ Reader.
If you have difficulty accessing any
material on the DTBE Web site because of a disability, please contact
us in writing or via telephone and we will work with you to make the information
available.
Division of Tuberculosis Elimination
Attn: Content Manager, DTBE Web site
Centers for Disease Control and Prevention
1600 Clifton Rd., NE Mailstop E-10
Atlanta, GA 30333
CDC-INFO at (1-800) 232-4636
TTY: 1 (888) 232-6348
E-mail: tbinfo@cdc.gov
|
 Home |
Site Map
| Contact Us
Home |
Site Map
| Contact Us
Accessibility
| Privacy Policy Notice |
FOIA
| USA.gov
CDC Home |
Search |
Health Topics A-Z
Centers for Disease Control & Prevention
National Center for HIV/AIDS,
Viral Hepatitis, STD, and TB Prevention
Division of Tuberculosis Elimination
Please send comments/suggestions/requests to:
CDCINFO@cdc.gov
|