|
Enhance Opportunities for America’s Workforce
America's engine of prosperity is its skilled workforce. The maintenance of our strong national economy depends, in part, on developing a steady stream of workers that are qualified job candidates possessing skills relevant to the needs of today's employers. The Department must ensure that every available labor pool is tapped, including job seekers with disabilities, veterans, and disadvantaged youth. DOL agencies and offices supporting this goal are the Employment and Training Administration (ETA), the Office of Job Corps (JC), Veterans' Employment and Training Service (VETS), the Office of Disability Employment Policy (ODEP), the Bureau of Labor Statistics (BLS), the Women's Bureau and the Center for Faith-Based and Community Initiatives.
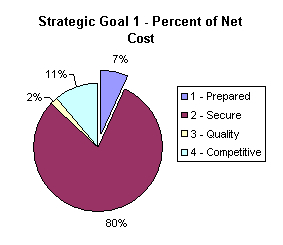
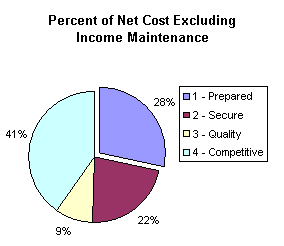
The net cost dedicated to Strategic Goal 1 in FY 2006 was $3.395 billion. The first chart below is based on total Departmental costs of $45.328 billion; the second is based on an adjusted net cost of $12.101 billion that excludes the major non-discretionary program costs associated with Strategic Goal 2.16 Net cost dedicated to Strategic Goal 1 in FY 2005 (restated to reflect current goal structure) was $3.250 billion.
The Department's performance in achieving this goal is determined by accomplishments organized at the outcome goal level and measured at the performance goal level. The two outcome goals are Increase Opportunities for New and Re-emerging Entrants to the Workforce (Outcome Goal 1.1) and Improve the Effectiveness of Information and Analysis on the U.S. Economy (Outcome Goal 1.2). Their results, costs, and future challenges are discussed below.
The Department recognizes that some members of the workforce face unique challenges. These groups include at-risk and out-of-school youth, veterans returning from service to their country, women making a significant work-life transition, and people with disabilities. Just as initial entry to the workforce requires education and training, re-entry may also require updating skills to match the needs of employers. The Department is working to prepare new and returning workers to take advantage of the growing job opportunities, which means making sure that no group is left behind. Through targeted training and outreach programs, partnerships that include faith-based and community organizations, and performance-based approaches, DOL provides comprehensive services that enable individuals belonging to these groups to achieve their employment goals.
The table below provides identifying information, goal statements, and achievement for DOL performance goals associated with this outcome goal. Those with labels that begin with "05" operate on a Program Year (PY) and are reporting on the period from July 1, 2005 to June 30, 2006 due to the forward funding mechanism of the Workforce Investment Act of 1998.
16The excluded costs are referred to as Income Maintenance — unemployment benefit payments to individuals who are laid off or out of work and seeking employment ($31.322 billion) plus disability benefit payments to individuals who suffered injury or illness on the job ($1.905 billion).
Goal (Agency) and Statement |
Performance Summary |
Cost (millions) |
FY 2005
PY 2004 |
FY 2006
PY 2005 |
05-1.1A (ETA)
Increase placements and educational attainments for youth served through the WIA youth program. |
Goal achieved. Both targets reached. |
$947 |
$1017 |
05-1.1B (JC)
Improve educational achievements of Job Corps students and increase participation of Job Corps graduates in employment and education. |
Goal not achieved. One target reached and two not reached. |
1309 |
1402 |
05-1.1C (VETS)
Improve the employment outcomes for veterans who receive One-Stop Career Center services and veterans' program services. |
Goal achieved. All six targets reached. |
196 |
198 |
06-1.1A (ETA)
Improve the registered apprenticeship system to meet the training needs of business and workers in the 21st Century. |
Goal achieved. Both targets reached. |
23 |
25 |
06-1.1B (ODEP)
Advance knowledge and inform disability employment policy that affects systems change throughout the workforce development system. |
Goal achieved. All three targets reached. |
52 |
50 |
Other (Youth Offender Reintegration, Indian and Native American Youth Programs, etc.) |
187 |
131 |
Total for Outcome Goal 1.1 |
Four performance goals achieved and one not achieved |
$2714 |
$2822 |
Results Summary
| After years of intermittent homelessness marked by episodes in shelters and hospitals, Isaac joined the HomeWork Project, an ODEP funded collaboration of housing, homeless assistance, mental health and One Stop career centers led by the Boston Private Industry Council. HomeWork staff helped him find an apartment subsidized by HUD and search for employment. Through the assistance of Job Net and the One Stop center, Isaac found work at a local behavioral health agency as a Clerk, starting at $10 per hour. At first, his limited English proficiency, computer skills and familiarity with telephone switchboards were cause for concern. However, his employer was able and willing to assign Isaac a supervisor who could communicate with him in his native language, Spanish, and to redefine specific duties to fit his skills. Isaac later asked for and received assistance to learn the skills in the original Clerk’s job description. Isaac said of his experience, “I would recommend this project to anyone without a home or a job. I am grateful that HomeWork is able to work with my treatment and language needs. This project has given me the opportunity I was looking for.” |
 |
| Photo credit: DOL/ODEP |
The WIA Youth program achieved its goal of collecting baseline data for its two new common measures for youth and lifelong learning performance in Federal employment and training programs. The Job Corps program, which uses the two common measures for placement and credentials, plus a third common measure for literacy/numeracy, did not achieve its goal. Job Corps established baselines for all three indicators in PY 2004 and set targets for PY 2005. Literacy/numeracy scores easily exceeded expectations, but results for placement and credentials were several percentage points below their targets. Both shortfalls are attributed to changes in data definitions or methods that will not apply in PY 2006.
VETS' goal was achieved; all six targets were reached. Veterans' employment rate improved as the retention rate was unchanged. Disabled veterans' employment rate stayed the same while retention improved over PY 2004. The employment and retention rates for homeless veterans both rose, too. This positive trend in outcomes is accompanied by reversal of a recent decline in service levels. Veterans' participation in One-Stop services increased approximately 5 percent over PY 2004; staff-assisted services increased approximately 10 percent.
The goal for Apprenticeship was achieved; retention and earnings results improved over FY 2005. In addition, efficiency, or average cost per registered apprentice, also improved to just under $100. Federal cost of the National Registered Apprenticeship System is low because training is provided by employers.
ODEP achieved its goal by establishing baselines for the number of policy-related documents disseminated and formal agreements initiated and reaching its target for identifying effective practices. These three indicators reflect ODEP's mission. The latter indicator has been in place since FY 2004; the new indicators emphasize a strategic shift from a reliance on grant-making to a greater focus on internally generated policy analysis and development initiatives.
Net Cost of Programs
The FY 2006 program costs of $2.822 billion supported ETA's registered apprenticeship and Workforce Investment Act Youth programs; Job Corps; Veterans' Employment and Training Service jobs programs; Office of Disability Employment Policy efforts to improve the workforce development system's services to job seekers with disabilities; Center for Faith Based and Community Initiatives contracting outreach; and Women's Bureau efforts to increase job opportunities for women.
The $2 billion increase in costs from FY 2003 to 2004 resulted almost entirely from moving the Dislocated Worker Program and Trade Adjustment Assistance (TAA) performance goals from Strategic Goal 2 (Outcome Goal 2.3 in the DOL FY 2003 Performance and Accountability Report). The TAA performance goal was moved again in FY 2005, along with several smaller ETA programs, to Outcome Goal 4.1 — accounting for roughly $1 billion of the decrease. In FY 2006, WIA Youth and Job Corps programs (combined cost of $2.419 billion) were added to this goal, and the WIA Adult, One-Stop, and Dislocated Worker programs (combined cost of $3.246 billion) moved to Outcome Goal 4.1. The total shown for FY 2005 has been restated to reflect these changes and facilitate comparison to FY 2006.
Future Challenges
The Department's FY 2006-2011 Strategic Plan — which was effective on September 29, 2006 — outlines a new vision for the delivery of youth services that emphasizes the potential of out-of-school and at-risk youth to help supply skilled workers for a globally competitive economy. Efforts are now focused on four major areas: alternative education, demand-driven strategies for serving youth that provide them with the skills businesses need, serving the neediest youth, and improved performance. For Job Corps, two key strategies are implementing integrated competency-based career and academic training and improving outreach and recruitment services. Residential facilities will also be managed to ensure maximum utilization and support the program's mission.
To improve employment outcomes for veterans, DOL is developing and implementing State Workforce Agency performance standards. VETS is also expanding the Recovery and Employment Assistance Lifelines program and its crosscutting efforts with the Departments of Defense and Veterans Affairs to provide individualized job training, counseling and re-employment services to seriously injured or wounded veterans of Operation Iraqi Freedom, Operation Enduring Freedom and other recent conflicts.
Apprenticeship program strategies include a re-examination of the Federal role, which may lead to proposed restructuring of the system. To strengthen program outcomes, DOL will more closely link apprenticeship programs with other workforce development and educational systems and enhance responsiveness to labor market demands through outreach to industry. DOL will expand credentialing in occupations and industries to increase options for career development. The Department will also promote recruitment, training, employment and retention of women in apprenticeship and nontraditional occupations.
The Department will continue to: develop national disability employment policy; foster implementation of effective policies and practices to increase employment among people with disabilities within state and local workforce development systems and with employers; conduct research that validates effective strategies for providing disability-employment related services and supports; and, provide technical assistance for implementing effective systems-change strategies to both the demand and supply side of the labor market.
Maintaining competitiveness in the 21st Century requires Americans to be knowledgeable about trends in the global, national, regional and local economies. Private citizens, business owners, and public officials need to have access to up-to-date, high-quality information and data to assist them in making better informed decisions. The Department's Bureau of Labor Statistics (BLS), which produces some of the Nation's most sensitive and important economic indicators, continuously seeks opportunities for innovation to improve the quality and usefulness of data products and services to customers.
Goal (Agency) and Statement |
Performance Summary |
Cost (millions) |
FY 2005 |
FY 2006 |
06-1.2A (BLS)
Improve information available to decision-makers on labor market conditions, and price and productivity changes. |
Goal not achieved. Four targets reached and two not reached. |
$536 |
$573 |
| For high school sophomores, the Morris Business and Professional Women operate a "Reality Store," which shows them the standard-of-living they can expect to achieve based on their career choices. Data from the Occupational Employment Statistics program helps the students determine how much "income" they may earn. Data from the Consumer Expenditure Survey sets the costs for various necessities and luxury goods available for "purchase" in stores set up at school. The Reality Store gives students a realistic look at the quality of life they can expect to attain from their chosen occupations, motivating them to take more seriously their remaining years in high school and possibly continuing on to higher education. Sara, of Minooka Community High School, said she had "heard the numbers before, but this really helped me realize what some things cost – groceries and kids are both expensive.” |
 |
| Photo credit: Hill, Minooka High School |
Results Summary
The goal was not achieved. However, BLS reached four of its six performance indicator targets, which include quality measures for its four categories of statistical surveys, an efficiency measure and a customer satisfaction index. Cost per transaction of the Internet Data Collection Facility, the agency's efficiency measure, improved over FY 2005 and came in below the target. Customer satisfaction also improved to 79 percent.& All output, timeliness, accuracy, and long-term improvement targets were reached for prices and living condition surveys and for productivity and technology surveys. For labor force statistics and compensation and working conditions surveys, however, achievement fell short of the targeted 85 percent performance levels. The labor force result reflects lower-than-expected response rates for four surveys, below-target expected coverage for two others, and one missed publication deadline. Compensation and working conditions surveys also experienced lower than anticipated response rates for two surveys and slight delays to several publications.
Net Cost of Programs
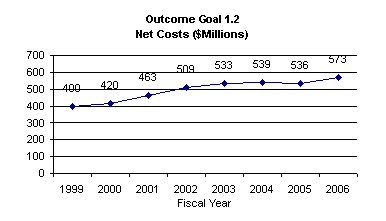
FY 2006 program costs of $573 million support BLS programs to produce and disseminate timely, accurate, and relevant information on the economy. Costs trended upward from 1999 to 2006, primarily due to built-in cost increases; the creation of new programs, such as the American Time Use Survey; and important improvements to increase the accuracy of survey programs, such as the Consumer Price Index (CPI), Producer Price Index (PPI), and Employment Cost Index (ECI).
Future Challenges
Several strategies support the goal of producing economic statistics that are relevant, timely, and accurate. The Department will better inform the public by increasing customer awareness and appropriate use of existing data products and will use feedback gathered from data users to determine how the data or dissemination media could be changed to better serve the American public. DOL will build value through innovation by analyzing and evaluating new economic survey methods, new technologies, and new survey design and collection approaches; and sponsoring research and evaluations by known experts to determine how best to improve BLS data. To reduce duplication of effort, the Department will collaborate with other statistical agencies to perform work more efficiently by improving communication and coordinating processes and methodologies.
Assist Youth in Making a Successful Transition to Work
Performance Goal 05-1.1A (ETA) — PY 2005
Increase placements and educational attainments for youth served through the WIA youth program.
Indicators, Targets and Results |
PY 2004
Result |
PY 2005
Target |
PY 2005
Result |
Target Reached* |
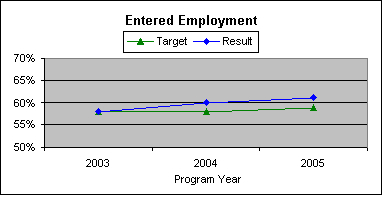
Percent of youth who are in employment or the military or enrolled in post secondary education and/or advanced training/occupational skills training in the first quarter after exit |
— |
Baseline |
58% |
Y |
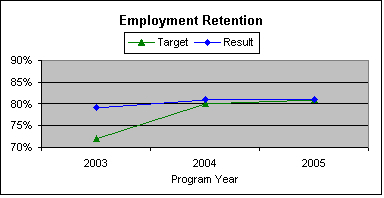
Percent of students who attain a GED, high school diploma, or certificate by the end of the third quarter after exit |
— |
Baseline |
36% |
Y |
Cost (millions) |
$947 |
— |
$1017 |
|
*Indicator target reached (Y), substantially reached (S) or not reached (N) |
|
|
Goal Achieved |
Program Perspective and Logic
The Workforce Investment Act (WIA) authorizes services to low-income youth (age 14-21) with barriers to employment. Eligible youth are deficient in basic skills or are homeless, are a runaway, are pregnant or parenting, are offenders, school dropouts, or foster youth. The program serves both in- and out-of-school youth, including youth with disabilities and other youth who may require specialized assistance to complete an educational program or to secure and hold employment. Service providers prepare youth for employment and post-secondary education by stressing linkages between academic and occupational learning. They also assist youth by providing tutoring, alternative schools, summer employment, occupational training, work experience, supportive services, leadership development, mentoring, counseling, and follow-up services.
For Program Year (PY) 2005, DOL collected data for two performance indicators, both of which are part of the common measures for youth and lifelong learning aspects of Federal employment and training programs. The first measures whether youth entered employment, advanced training or education after leaving the program. This indicates whether DOL is transitioning youth into the workforce or post-secondary education, which is a key to successful careers. The second indicator, which measures whether participants earned educational credentials, is a proxy for preparedness of participants to compete in the 21st century knowledge-based economy.
Costs associated with this program increased by approximately seven percent from PY 2004 and PY 2005. States have two years to expend obligated funds, and some fluctuation from year to year is to be expected. In addition, Congress and the Administration have encouraged States and other grantees to spend funds more quickly.
| Brittany was married at 17. Focused on getting a job in the medical field, she dropped out of high school in 2003 and soon began Certified Nurse’s Assistant classes. However, Brittany was also pregnant and soon found herself unable to complete her coursework. It looked like Brittany was going to have to scrap her plans of working in a health career altogether. In 2005, after giving birth to her son, Brittany realized the importance of her education and its place in her future success. She began working with JobWorks in September 2005, obtained her GED in October, and passed the CNA exam in November. Brittany is now not only a proud mother, but also a CNA employed at a local nursing home and researching classes to become an Obstetrics Technician. |
 |
| Photo credit: Michelle Ginder |
Analysis and Future Plans
The goal of collecting baseline data for the placement in employment or education and attainment of a degree or certificate indicators was achieved. During PY 2005, DOL continued to implement strategies that emphasize that out-of-school and at-risk youth are an important part of the new workforce "supply pipeline" needed by businesses to fill job vacancies in the knowledge economy. WIA-funded youth programs connect these youth with quality secondary and post-secondary educational opportunities and high-growth and other employment opportunities. DOL works with the Departments of Health and Human Services, Education, Justice, Housing and Urban Development, plus the Social Security Administration and the Corporation for National and Community Service to assist States in coordinating resources and program delivery strategies to secure positive outcomes for the neediest youth. In addition, DOL is working specifically with the Department of Education to identify and replicate effective approaches to increasing graduation rates for disconnected and out-of-school youth.
For PY 2006, DOL has set targets of 60 percent for placement in employment or education and 40 percent for degree or certificate attainment. In addition, DOL will collect baseline data during PY 2006 for literacy/numeracy gains, another common performance measure for youth and lifelong learning programs. One factor that will limit the rate of progress in measured results in the near term is increased emphasis on serving out-of-school youth and the neediest youth, a population that has historically had lower performance on employment and education outcome measures. However, as the participant population stabilizes and programs become more effective in serving out-of-school youth, results should subsequently improve.
PART, Program Evaluations and Audits
The program received a rating of Ineffective in the 2003 PART review. The program improvement plan included recommendations to adopt common performance measures for Federal job training programs and conduct an impact evaluation of the WIA Youth program. For PY 2005, ETA issued revised reporting instructions to States that required reporting outcomes using the common measures, and the baseline results above represent DOL's progress in completing this recommendation. An impact evaluation will be commissioned upon WIA reauthorization, as knowledge of the program's new direction will be critical to the design of any meaningful study.
In response to allegations regarding expenditure of funds granted to Arkansas, the OIG recommended that ETA strengthen its guidance to States on proper use of WIA funds (see Insufficient Federal Guidance Could Result in Misuse of Incumbent Worker Training Program Funds — Study 1 in Appendix 2). At issue was Arkansas' award of WIA incumbent worker funds to attract business. ETA subsequently determined that all of the questioned costs were indeed allowable under WIA law and regulations. However, ETA agreed that additional policy guidance is needed to address incumbent worker training generally and specific economic development and employer assistance activities prohibited by WIA. In March 2006, ETA issued Training and Employment Guidance Letter No. 18-05, which clarifies appropriate use of WIA funds granted for incumbent worker training.
In December 2005, the Government Accountability Office (GAO) examined those data quality issues that have affected States' efforts to collect and report WIA performance data in Workforce Investment Act: Labor and States Have Taken Actions to Improve Data Quality, but Additional Steps Are Needed (Study 2 in Appendix 2). GAO found that DOL does not effectively hold States accountable for complying with its validation requirements; guidance on implementing common performance measures issued July 1, 2005 does not address all the issues; and the Department lacks a standard monitoring guide to address data quality. DOL has already conducted its own review of WIA participant files, has been working with States on data validation requirements, and has developed a standard monitoring tool for WIA performance data. DOL also plans to modify the current data validation software to allow Federal staff the opportunity to pull a sample of the validation records at the State level for review, and is in the process of designing the development and layout of the monitoring guide.
Data Quality and Major Management Challenges
Data quality for this performance goal was rated Very Good. Strengths of the data included its relevance, reliability, and routine verification. While verification remains an area for improvement, extensive effort has been directed toward improving data quality through the use of ETA's data validation system and monitoring at both the national and regional levels. Per the PART improvement plan, the Youth program has now implemented two of the common performance measures. Data are reported quarterly, and there are no gaps. As mentioned in the preceding paragraph, further improvements are expected to result from planned enhancements to the current validation software and the monitoring guide. DOL is working to ensure data quality in response to the GAO study detailed above.
Increase Placements and Educational Attainments of Youth
Performance Goal 05-1.1B (JC) — PY 2005
Improve educational achievements of Job Corps students and increase participation of Job Corps graduates in employment and education.
Indicators, Targets and Results |
PY 2004
Result |
PY 2005
Target |
PY 2005
Result |
Target Reached* |
Percent of Job Corps graduates (within 1 year of program exit) and former enrollees (within 90 days of program exit) who enter employment or enroll in post-secondary education or advanced/occupational skills training |
84% |
85% |
80% |
N |
Percent of students earning a high school diploma, General Equivalency Diploma (GED) or certificate while enrolled in a Job Corps program |
64% |
64% |
60% |
N |
Percent of students who will achieve literacy or numeracy gains of one Adult Basic Education (ABE) level (approximately equivalent to two grade levels) |
47% |
45% |
58% |
Y |
Cost (millions) |
$1309 |
— |
$1402 |
|
*Indicator target reached (Y), substantially reached (S) or not reached (N) |
|
Goal Not Achieved |
Program Perspective and Logic
Job Corps is an intensive educational and vocational training program (primarily residential) for economically disadvantaged youth ages 16 through 24 who often face multiple barriers to gainful employment. This program provides career counseling, technical skills and academic training, social education, and other support services, such as housing, transportation and family support resources to more than 60,000 individuals at 122 centers nationwide. Job Corps centers, ranging in size from 200 to 2000 students, are located in both urban and rural communities, and are operated by large and small companies under performance-based contracts. Job Corps centers provide individually tailored services to help students achieve the skills and credentials required to be successful, productive citizens and to obtain work opportunities that lead to long-term employment.
As with other employment and training programs, Job Corps' performance can be influenced by external factors such as local labor market conditions and national economic trends. In recent years, an increasingly knowledge-based labor market has challenged Job Corps to redirect both academic and technical career training approaches. In Program Year (PY) 2005, Job Corps was presented with, and responded to, significant challenges as a result of Hurricane Katrina. Physical damage to Job Corps centers necessitated relocating students, moving staff and closing both the New Orleans and Gulfport centers until repairs to the infrastructure and full operations can be restored.
Performance of the Job Corps program is assessed using the Federal job training common measures for youth and lifelong learning programs. These three measures — placement in employment or education, attainment of a degree or certificate, and literacy or numeracy gains — are indicators of student achievement in enhancing their long-term employability.
Between PY 2004 and PY 2005, Job Corps' cost rose by seven percent. The increase was due to escalating utility and health care rates and full funding of new centers.
| Busy filling prescriptions, Darshay can’t help but feel successful. A few years ago, when Darshay was still undecided about her future, she enrolled in the Jacksonville Job Corps Center, where she received training to become a pharmacy technician and even completed two internships in retail pharmacy sales. After graduating from Job Corps, she spent six weeks at Walgreens and six weeks at a local military base. She was then hired temporarily at the base and was quickly transferred into a permanent position at another local base, where she works at a pharmacy that fills between 1,500 and 2,000 prescriptions daily. Although she has a good job, Darshay is continuing her education at a local community college so she can eventually go to pharmacy school. |
 |
| Photo credit: Ken McCray |
Analysis and Future Plans
In PY 2005, the second year of measuring learning gains, Job Corps continued to exceed its target, increasing literacy or numeracy scores by one Adult Basic Education (ABE) level for 58 percent of all students who were deficient in basic skills at entry. However, certificate attainment — students achieving a high school diploma (HSD), GED or vocational certificate while enrolled in Job Corps — fell below the target of 64 percent. More aggressive data integrity reviews revealed that in past years misreporting of certificate attainments may have occurred; the resulting stringent documentation requirements may have therefore contributed to the drop in HSD, GED and vocational certificate attainments reported.
The pool of students included in employment/education outcome reporting (the first indicator in the table above) has grown over the past few years due to the addition of former enrollees who did not complete their programs, but were enrolled in Job Corps for more than 60 days. This lowered overall success rates because outcomes for most of these people are unknown. PY 2004 was the first year that former enrollees were included, producing a modest impact on the results. In PY 2005, however, the full effect was apparent, as placement results dropped five percentage points.
To improve performance in PY 2006, Job Corps will continue to utilize performance-based service contracting for center operators and Career Transition Services (CTS) providers to link revenues to performance on specific measures of student success. Regional offices conduct assessments and annual contract reviews of outreach and admissions contractors, center operators and CTS providers that include compliance measures for operations and performance measures related to student outcomes. In addition to improving measured student outcomes, Job Corps continues to focus on customer needs by maintaining safe and healthy environments at all Job Corps centers by cooperatively working with other DOL agencies to conduct safety and health inspections annually.
PART, Program Evaluations and Audits
In the 2004 Program Assessment Rating Tool (PART) process, the Job Corps program was reviewed and rated Moderately Effective. In response to findings, DOL created a strategic plan to improve services for Hispanic/Latino students and those who are English Language Learners, completed an Asset Management Plan and Capital Asset Plan for the FY 2007 Budget, improved decision-making processes for capital investments in real property, assembled a cost effectiveness workgroup to improve program efficiency, and obtained access to Unemployment Insurance wage record information to more completely report on student employment outcomes.
In PY 2005, the Office of Inspector General (OIG) identified several areas of concern related to Job Corps' data validation procedures and improper payments to the center operator. See San Diego Job Corps Center: Student Attendance and Training Data Overstated (Study 4 in Appendix 2). In response to the OIG findings, Job Corps updated its oversight policy to require regional offices to validate centers' data using a targeted sampling of records during onsite center assessments and to take steps to recover overpayments if irregularities are identified.
Another recent OIG study, Strengthening Efforts to Assess and Account for Students with Cognitive Disabilities Would Help Job Corps Achieve its Mission, suggested that Job Corps provide additional services to permit early identification of students with unknown or undisclosed disabilities (Study 3 in Appendix 2). In response, Job Corps developed policies for assessing students with cognitive disabilities and has established a formal audit system for tracking the accuracy of centers' disabilities data.
Data Quality and Major Management Challenges
Data quality for this performance goal was rated Very Good. Strengths of the data include timeliness, validity, and accuracy. The Job Corps program has developed policies and procedures for its Management Information System (MIS) to address data integrity issues identified in recent OIG audits (see previous section). Steps being taken include revisions to the Program Assessment Guide, utilization of targeted sampling for audit reviews, and procedures for identification and collection of liquidated damages as necessary. To ensure system-wide data integrity, Job Corps is in the process of updating the guide and has implemented requirements for regional offices to include mandatory reviews of individual student files selected through a stringent targeted-sampling methodology. These changes will shortly be released to the field. While verification remains an area for improvement, Job Corps has implemented quality controls — on-site reviews of targeted samples by teams composed of National and Regional Office staff and experienced data analysts.
Job Corps Real Property is listed as a Departmental Major Management Challenge (MMC) by virtue of the fact that this program controls roughly 95 percent of the DOL real property portfolio that is not leased through the General Services Administration (see item IX in the MMC table in the Executive Summary — Ensuring the Effectiveness of the Job Corps Program). Executive Order 13327, Federal Real Property Asset Management, was issued by President Bush in February 2004 "to promote the efficient and economical use of America's real property assets." In PY 2005, Job Corps instituted new controls in CATARS (Capital Asset Tracking and Reporting System), the Departmental tracking system. As a result, annual inventories of Job Corps Real Property are now conducted in accordance with Departmental guidance and the information in CATARS is verified.
Help Veterans Get and Keep Jobs
Performance Goal 05-1.1C (VETS) — PY 2005
Improve employment outcomes for veterans who receive One-Stop Career Center services and veterans' program services.
Indicators, Targets and Results |
PY 2004
Result |
PY 2005
Target |
PY 2005
Result |
Target Reached* |
Percent of veteran job seekers employed in the first or second quarter following registration |
60% |
59% |
62% |
Y |
Percent of veteran job seekers still employed two quarters after initial entry into employment with a new employer |
81% |
81% |
81% |
Y |
Percent of disabled veteran job seekers employed in the first or second quarter following registration |
56% |
55% |
57% |
Y |
Percent of disabled veteran job seekers still employed two quarters after initial entry into employment with a new employer |
79% |
79% |
80% |
Y |
Entered employment rate for homeless veterans participating in the Homeless Veterans' Reintegration Program (HVRP) |
65% |
61% |
68% |
Y |
Employment retention rate after 6 months for homeless veteran HVRP participants |
58% |
58% |
67%** |
Y |
Cost (millions) |
$196 |
— |
$198 |
|
*Indicator reached (Y), or substantially reached (S) or not reached(N)
**Estimated based on results through the second quarter |
Goal Achieved |
Program Perspective and Logic
Jobs for Veterans State grants support the delivery of employment services needed by veterans and transitioning service members to promote their success in the civilian workforce. These grants support Disabled Veterans' Outreach Program (DVOP) specialists and Local Veterans' Employment Representative (LVER) staff members stationed at the nationwide network of One-Stop Career Centers. Both DVOP specialists and LVER staff members serve as experts on workforce resources available for veterans. LVER staff members emphasize the provision of services for recently separated veterans and handle outreach to employers. DVOP specialists focus their efforts on intensive services for disabled veterans and for other veterans with significant barriers to employment. The Homeless Veterans' Reintegration Program (HVRP) is a competitive grant program emphasizing stable employment as the critical factor in mitigating homelessness among veterans. Program participants are served by community-based grantees that provide pre-employment services, establish linkages with service providers funded by other federal agencies, and rely on DVOP specialists to assist in placing participants, once they are job-ready.
One-Stop Career Centers serve younger, recently separated veterans who have limited civilian work experience and older veterans with civilian experience who have become unemployed. HVRP serves homeless veterans who have minimal attachment to the workforce. VETS applies the federal job training common measure definitions of entry to employment and retention in employment as the critical indicators of successful outcomes for all veterans and all disabled veterans who receive One-Stop services. For HVRP, VETS also uses entry to employment and retention in employment as the key outcome indicators and plans to apply the common measure definitions of these indicators starting in 2007. In setting performance targets, VETS seeks to improve service to veterans at a rate that is ambitious yet attainable.
Cost for this performance goal rose by one percent between PY 2004 and PY 2005. This is considered a minor variance.
Analysis and Future Plans
The goal was achieved; all six targets were reached. The veterans' employment rate improved by two percentage points over PY 2004 results, while the retention rate was unchanged. The employment rate and the retention rate for the disabled veterans cohort both improved by one percentage point. The employment rate for homeless veterans served by HVRP improved by three percentage points and surpassed the target. Based on preliminary results, the HVRP retention target was reached. Final data are received too late for inclusion in this report but are not expected to change this result. During 2006, VETS will continue efforts to emphasize retention for HVRP.
Broad national economic indicators for unemployment and productivity remained generally positive over the past twelve months and helped to maintain positive performance by the veterans' programs. These positive results also are attributable, in part, to continued efforts by VETS to facilitate coordination among VETS State offices, State Workforce Agencies and community-based grantees, such as those responsible for implementing HVRP. In addition to the positive impact of this coordination on veterans' outcomes, it also played a role in reversing the downward trend in service levels that was noted in last year's report. Specifically, a comparison with the previous year indicates that the overall level of veteran participation in One-Stop services (including self-services) increased approximately 5 percent, while the level of veteran participation in staff-assisted services increased approximately 10 percent.
| Early in 2004, HVRP staff met and interviewed John when he was a resident at the Florida Volunteers of America (FVA) facility. John was not initially chosen to participate. Within two months, John vanished. In March 2005, FVA staff attended the Brevard County Homeless Veterans Stand Down event, where HVRP staff assisted with veterans’ employment issues. Sitting at a nearby table was John. His arm was badly bruised and needed medical attention. He had been sleeping in the woods since leaving their facility a year earlier. HVRP contacted the Brevard County Homeless Veterans Coordinator, who then arranged for medical help and lodging. A few weeks later, John returned to the FVA facility. By May, John had made remarkable improvements, and he was enrolled in the HVRP program. John found a job as a drywall installer but was lacking the necessary tools and equipment. HVRP staff procured the tools and equipment just in time to allow John to begin his new job – which paid $13 per hour. HVRP has since confirmed that John is still employed. John said he knows what it is like to really bottom out, and that he won’t be going there again. |
 |
| Photo credit: DOL/VETS |
PART, Program Evaluations and Audits
The PART review of the Jobs for Veterans State Grants Program, published in February 2006, rated the program Moderately Effective and noted that it serves a large number of veterans, while focusing on those veterans requiring more intensive services by leveraging other resources within the workforce investment system. The improvement plan included setting more ambitious indicator targets and conducting an independent evaluation to assess the effects of recent program changes on employment outcomes. VETS has taken significant action on both items by including ambitious long-term targets in the DOL Strategic Plan and participating in the launch of the evaluation project in August 2006.
In December 2005, GAO published a study on the implementation of the Jobs for Veterans Act, Labor Actions Needed to Improve Accountability and Help States Implement Reforms to Veterans' Employment Services (see Study 5 in Appendix 2). GAO's recommendations included four areas for improved coordination between VETS and ETA: a) improved integration of veterans' representatives at One-Stop Career Centers; b) improved provision of priority of service for veterans; c) coordination of monitoring activities; and d) application of monitoring results to improve program performance. GAO also recommended that VETS disseminate information on best practices and improve monitoring of federal contractors' compliance with obligations related to veterans' employment. These actions are expected to be completed during FY 2007.
Employment Rates for Disabled Veterans, an evaluation of services and assistance provided referrals to DVOP specialists from the Office of Vocational Rehabilitation and Employment (VR&E) at the Department of Veterans Affairs (see Study 6 in Appendix 2), identifies areas for follow-up by VETS/VR&E workgroups. VETS and VR&E have a Memorandum of Agreement (MOA) which in part establishes three work groups; performance measures; training; and data collection and sharing. There are issues in the report that the work groups will address that will ultimately lead to better employment outcomes for this group of disabled veterans. Recommendations were made by DVOPs and VR&E staff that includes involving DVOP specialists in the development of employment and training plans for VR&E participants; consider having DVOPs become certified as Career Development Facilitators; and develop mutually agreeable outcome measures. The report was issued at the conclusion of FY 2006 and the work groups have not had an opportunity to review the report and outline a course of action.
Data Quality and Major Management Challenges
Data quality for this performance goal was rated Good. Strengths of the data include its relevance, timeliness, and completeness. The four indicators addressing the outcomes of veterans and disabled veterans served by One-Stop Career Centers rely upon the reporting system that produces similar outcome data for DOL Performance Goal 05-4.1B. Therefore, in general, the data quality assessment for that goal also applies to these indicators. The two indicators addressing outcomes for homeless veterans served by HVRP rely upon the Veterans' Employment and Training Operations and Program Activity Report (VOPAR). VOPAR areas for improvement are reliability and verifiability. During 2007, VETS intends to develop a second generation VOPAR to accommodate common measures and to add internal consistency checks. VETS also intends to emphasize greater consistency in grantee reporting and more uniform verification of reports by VETS field staff members responsible for grantee oversight. Routine quality control measures include trouble-shooting by expert VETS field staff members who oversee HVRP and workshops on reporting at the annual conference attended by all grantees' representatives and all VETS field staff members who oversee HVRP. VETS has no major management challenges.
Satisfy High-Growth Industry Labor Needs via Apprenticeships
Performance Goal 06-1.1A (ETA) — FY 2006
Improve the registered apprenticeship system to meet the training needs of business and workers in the 21st Century.
Indicators, Targets and Results |
FY 2005
Result |
FY 2006
Target |
FY 2006
Result |
Target Reached* |
Percent of those employed nine months after registration as an apprentice |
78% |
78% |
82% |
Y |
Average wage gain for tracked entrants17 employed in the first quarter after registration and still employed nine months later |
$1.26 |
$1.26 |
$1.32 |
Y |
Cost (millions) |
$23 |
— |
$25 |
|
*Indicator target reached (Y), substantially reached (S) or not reached (N) |
Goal Achieved |
Program Perspective and Logic
The National Apprenticeship Act of 1937 established the foundation for developing and expanding the nation's skilled workforce through apprenticeship programs and establishing standards for safeguarding the welfare of apprentices. The National Registered Apprenticeship System — a partnership of the Department of Labor, State agencies, businesses, program sponsors, industry leaders, employers, employer associations, and educational institutions — was established with the objective of providing opportunities for jobseekers to find jobs with career paths, earn competitive wages, and obtain nationally-recognized industry credentials. The system is responsible for promoting and registering programs and apprentices, certifying standards, safeguarding the welfare of the apprentices, and providing a nationally recognized system for skilled and technical occupational training programs throughout the U.S.
DOL staff promotes the apprenticeship training system to potential sponsors and participants and registers and monitors the partners' apprenticeship programs. Industry leaders, employers, or employer associations develop apprenticeship programs based on the skills and knowledge required for workers in particular occupations. The Department or a Federally-approved State Apprenticeship Council registers programs to certify that they meet standards for quality, fairness, and opportunity, and adequately incorporate the two critical components of a registered apprenticeship program — on-the-job learning with appropriate supervision and related technical instruction. Educational institutions, such as community colleges, may collaborate with sponsors to provide the occupation-related instruction.
The apprenticeship model has demonstrated success in developing skilled workers for numerous industries and continues to provide employers with resources to develop new occupations and train a skilled workforce to remain globally competitive. Registered Apprenticeship functions as a self-sustaining system with employers financing most training expenses such as wages, classroom training, supervision, and mentoring for the duration of the program, which can be several years.
FY 2005 was the baseline year for collecting data on the Federal job training program common performance measures of employment retention and wage gain, which reflect individual apprentice outcomes and allow for broad comparison with other ETA training and employment programs. With limited data available to assess trends in program performance, FY 2006 targets were set at levels deemed realistic and attainable. As additional data become available and as partners acclimate to these new performance indicators, the Department will analyze trends and set higher targets, as appropriate. As a system based on voluntary employer participation, apprenticeship program performance is directly impacted by external factors such as wage rates determined by local employer sponsors and by demand for skilled and technical labor in local markets.
Costs associated with this performance goal increased by one percent between FY 2005 and FY 2006, which is considered a minor variance.
| For staff working in Maine’s veterinary hospitals and animal clinics, becoming certified as a Veterinary Technician has not really been a viable option, but the Maine Apprenticeship program has found a solution. Apprentices now can access an approved web-based Veterinary Technician program through a Texas community college that provides post-secondary education and on-the-job training. For Victoria at Bridgton Veterinary Hospital and Shelly (pictured in photo) at Falmouth Veterinary Hospital, this combination of on-the-job training and long distance learning has provided them the opportunity to advance their careers while continuing to work. Apprenticeship, as this program clearly demonstrates, can offer a flexible and creative alternative to post-secondary education that allows workers to become trained and well-rounded in their career choices. |
 |
| Photo credit: Gene Ellis |
Analysis and Future Plans
Results exceeded targets for both indicators; therefore the Department achieved its performance goal. Retention was 82 percent, or 4 percentage points above the target of 78 percent. The hourly wage gain of $1.32 (from $12.16 to $13.48) is almost 5 percent greater than the FY 2005 wage gain of $1.26 (from $11.92 to $13.18). In addition, the average cost per registered apprentice was $97, or $12 less than the previous year's result of $109. While the program's operating budget increased by just one percent from FY 2005 to FY 2006, the number of registered apprentices increased by more than 20 percent — from 196,000 to over 237,00018. This considerably reduced the program's cost per participant. Apprenticeship's results continue to demonstrate that the Apprenticeship program is efficient as a Federal training and employment program. By leveraging large investments from employers and program sponsors, Apprenticeship is a low cost, market-driven approach to training America's workers.
To improve performance in future years, the Department and our stakeholders are re-engineering Registered Apprenticeship Information System (RAIS), the DOL's database for registered apprenticeship programs. The RAIS re-engineering will enable DOL to better analyze program information and strategically target expansion in industries and occupations that demonstrate higher wages and apprentice retention rates. Additionally, DOL is preparing to conduct a survey of employer sponsors regarding their views on apprenticeship, knowledge of the apprenticeship system, data collection activities, and integration with the workforce development system. The survey information will help re-orient Federal policy on apprenticeship, and will help State Apprenticeship Councils promote apprenticeship in new industries and with more employer sponsors. Finally, the Department is promoting the recruitment, training, employment and retention of women in apprenticeship and nontraditional occupations through Women in Apprenticeship and Nontraditional Occupations (WANTO) grants in partnership with the Women's Bureau. Grantees, which will be a consortium of apprenticeship sponsors, community-based organizations, and faith-based organizations, will successfully recruit, train, employ and retain women in apprenticeships and nontraditional occupations.
PART, Program Evaluations and Audits
In 2005, the program was reviewed using the Program Assessment Rating Tool (PART) and rated Results Not Demonstrated — reflecting lack of data on the common measures at that time. The improvement plan included completing implementation of the common measures for retention and earnings; evaluating and reporting participants' employment and earnings after they leave the program to compare apprenticeship program outcomes with those of other training models; and tracking the representation of women in apprenticeship programs through an Equal Employment Opportunity review process. The program has implemented the new measures and the aforementioned re-engineering of RAIS includes capture of post-training outcomes. In collaboration with the Women's Bureau, ETA will award grants (using WANTO grants funds) to assist employers and labor unions in the placement and retention of women in apprenticeship and nontraditional occupations.
Data Quality and Major Management Challenges
Data for this performance indicator was rated Fair. Strengths of the data include its validity and accuracy, but room for improvement remains in several areas. The primary data source is RAIS, an automated system that operates independently from State workforce information systems. For the 27 states in which State Apprenticeship Councils (SAC) register apprentices, participation in RAIS is voluntary; complete nationwide data are not available and the collection of retention and earnings data continues to be challenging. Recent implementation of common measures will affect the ability to compare performance trends in the short term. As indicated in the footnote on the first page of this goal narrative, wage gain data are limited to Federal efforts. RAIS will be redesigned to include trend analysis capability and offer features to encourage SACs to utilize the new data collection system, as well as greater quality controls to ensure data collected from the States are accurate.
Efforts continue to determine how Unemployment Insurance wage record information may be accessed to verify employment outcomes of registered apprentices. It is anticipated that the redesigned RAIS will considerably reduce the estimated staff hours needed to report the earnings indicator. Both GAO's 2005 study (Registered Apprenticeship Programs: Labor Can Make Better Use Data to Target Oversight) and the PART review discussed the potential of technology to improve services. These enhancements to RAIS will address a Major Management Challenge (MMC) — Improve Apprenticeship Data, item I in the MMC section of the Executive Summary — by making better use of performance data for program oversight and developing a cost-effective strategy for collecting data from SACs. For example, two additional states have agreed to participate in RAIS. Additionally, the Department continues to expand the Apprentice Electronic Registration (AER) project in RAIS to reduce application processing time, improve data quality, increase cost-effectiveness, and improve the program's ability to track data. AER's utilization rate increased to from nine percent of participating States in FY 2005 to 46 percent in FY 2006.
The Department continues efforts that began in FY 2005 to review apprenticeship activities in SAC states. Monitoring reviews for SACs and the District of Columbia were completed in FY 2006 and final reports identifying areas for technical assistance will be issued in FY 2007.
17Twenty-three States have Federally registered apprenticeship programs and enter data on individuals into the Registered Apprenticeship Information System (RAIS). A group of "tracked entrants" is defined as the cohort of apprentices registered and entered into RAIS during a given reporting period.
18As of September 15 — two weeks prior to the end of the fiscal year.
Increase Employment Opportunities for Youth and Adults with Disabilities
Performance Goal 06-1.1B (ODEP) — FY 2006
Advance knowledge and inform disability employment policy that affects systems change throughout the workforce development system.
Indicators, Targets and Results |
FY 2005
Result |
FY 2006
Target |
FY 2006
Result |
Target Reached* |
Number of policy related documents disseminated |
NA |
Baseline |
20 |
Y |
Number of formal agreements initiated |
NA |
Baseline |
20 |
Y |
Number of effective practices identified |
19 |
21 |
26 |
Y |
Cost (millions) |
$52 |
— |
$50 |
|
*Indicator target reached (Y), substantially reached (S) or not reached (N) |
Goal Achieved |
Program Perspective and Logic
The Office of Disability Employment Policy (ODEP) works to reduce and remove the significant barriers to employment faced by individuals with disabilities. ODEP also ensures coordination among DOL and other Federal agencies on matters related to or affecting employment of people with disabilities.
Increasing workforce participation of people with disabilities requires the removal of barriers found on both the supply (those seeking employment) and demand (employers) sides of the labor market. Key components of ODEP's investments include developing national policy related to and affecting employment of people with disabilities; fostering implementation of effective policies and practices within State and local workforce development systems and with employers; conducting research that validates effective strategies for providing disability-employment related services and supports; and providing technical assistance for effective implementation of systems-change strategies to both the demand and supply side of the labor market. In addition, ODEP seeks to ensure that employers' perspectives on the recruitment, retention, and promotion of people with disabilities are fully integrated into disability employment policy analysis and development. ODEP works with key stakeholders in the Department, other Federal, state, and local governments, non-governmental organizations, and employers, developing policy and effective practices to increase employment opportunities for people with disabilities that will expand access to workforce systems, address the needs of employers, and ensure the availability of employment-related supports. ODEP also supports the implementation of the employment-related goals of President Bush's New Freedom Initiative.
ODEP's response to the traditionally low employment rates among people with disabilities is comprehensive and aggressive, and includes securing the active involvement and cooperation among a number of Federal, State, and local agencies as well as private sector organizations. ODEP strategically invests in initiatives to identify and develop policy options that will improve employment rates of people with disabilities and to validate effective practices for dissemination throughout the workforce development and other service delivery systems and to employers. ODEP's investment provides the policy and practices for those systems so that they will achieve better employment outcomes for the individuals with disabilities they serve. These investments also provide employers with the information they need to benefit from their increased recruitment, retention and promotion of people with disabilities. The results of these initiatives and their activities — in the form of policy related documents, formal agreements, and effective practice identification — are reflected in the indicators and targets used to measure ODEP's performance.
Major external factors that influence performance outcomes include several workforce trends. These trends include projected workforce shortages, turn-over, retirement, and the trend of working beyond the traditional retirement age. Many of these workers may experience disabling conditions, increasing pressure on the employer to keep workers on the job and to have employees who are temporarily disabled return to work quickly. Additionally, small businesses — which employ half of all private sector employees and are expected to generate a majority of new jobs — face unique challenges in hiring and retaining disabled workers.
ODEP develops policies and practices that enable employers to include people with disabilities as they develop strategies for employee recruitment, development and transition with the goal of retaining long-term, high-quality, high-contributing employees. Additionally, ODEP develops policies and practices that enhance coordination of the support needed to keep workers on the job and return employees to work quickly following an injury or illness. This support includes access to healthcare, housing, and reliable transportation.
| A career specialist from the MontgomeryWorks One Stop Career Center contacted Dr. Robert Morgenstein, a dentist in the Rockville, MD area, at the suggestion of a patient, to find out more about his practice. He and his staff welcomed a discussion of their office tasks and alternative work flow designs. Needs included ushering patients from the waiting area to the appropriate room, pulling and re-filing patient's charts, running errands to the post office, making bank deposits, and additional light clerical tasks. Ramon DePaula, who was seeking clerical work with some personal interaction, had some, but not all of the capabilities identified by Dr. Morgenstein and his staff. The career specialist was able to negotiate an opportunity for Ramon to demonstrate his fitness for the practice in conjunction with implementation of a streamlined office operation. After a volunteer work trial, Ramon was hired as a clerical assistant. His position was created to fill specific needs in the busy dental office and matched to his interests and skills. According to Dr. Morgenstein, "Ramon's new position allows the front office staff to spend more quality time updating patient charts." |
 |
| Photo credit: DOL/ODEP |
Analysis and Future Plans
ODEP achieved its goal. As planned, during FY 2006, a year in which ODEP underwent a management paradigm shift, it continued collecting data from activities and initiatives. ODEP has been tracking one indicator — number of effective practices identified — since FY 2004. ODEP also began developing definitions and valid tracking mechanisms for two new indicators. At the close of FY 2006, ODEP set baselines for these two indicators. The policy-related documents baseline is 20 and the formal agreements baseline is 20, also. These three indicators, which measure achievement of ODEP's performance goal, more clearly and accurately reflect the agency's focus on policy development than did previous indicators. ODEP exceeded its target of identifying 21 effective practices, having identified 26.
In FY 2007, ODEP will complete its management paradigm shift, emphasizing different strategies than in the past. ODEP will move away from its earlier, heavy reliance on grant making to public and private organizations to a greater emphasis on using its own internal staff to conduct policy analysis and development initiatives. Activities will continue to focus on ODEP's core mission to develop and influence the implementation of policies and practices that will affect systems change, increasing employment opportunities for, and the recruitment, retention, and promotion of adults and youth with disabilities. Accordingly, the proposed FY 2007 Performance Goal will remain as presented in FY 2006.
ODEP has reduced cost from $52 million in FY 2005 to $50 million in FY 2006. Cost for both years also reflects funds awarded in prior fiscal years; the reduction is attributed to a decrease in the budget request and appropriation. The impact of reduced funding was a significant reduction in pilot project and technical assistance grants. ODEP was able to use information from those grants in the development of policy. DOL expects ODEP's budget to either remain at its current level or to be further reduced. While in the future ODEP will more heavily rely on its staff of disability and policy subject matter and technical experts as well as other strategies to achieve its goal, it will also continue to draw from information gained from previous pilot project grants.
PART, Program Evaluations and Audits
ODEP is being reviewed in this year's PART process; results will be available with release of the FY 2008 President's Budget. ODEP's independent evaluation is examining the nature and extent to which ODEP's efforts in pilot projects have increased the capacity of the workforce development system and other systems to serve people with disabilities. As implementation has progressed, the evaluation is also examining capacity building (e.g., new policies and coordinating vocational rehabilitation, mental health, transportation, and housing funds; appropriately trained staff; formal cooperative agreements with local agencies; and intermediate outcomes (i.e., more people with disabilities being served leads to more people with disabilities getting jobs or moving out of government services such as Social Security). Findings continue to demonstrate that because of ODEP's efforts: (1) The capacity of the workforce development system has expanded and the system is strengthened to better serve people with disabilities; (2) People with disabilities are moving from low-skill, minimum wage work to higher-paid jobs in technical or other new career fields; (3) Attitudes at One-Stop Centers regarding the provision of services to people with disabilities are changing; and (4) Governmental agencies are now working together to share information and leverage resources to better serve people with disabilities.
Data Quality and Major Management Challenges
Data for this goal was rated Good. Strengths of the data include timeliness, verifiability, and completeness. ODEP relies on contracted external evaluators to validate the data collection systems that support their performance measures. As ODEP continues to implement its strategic and performance plan, data quality can be improved to ensure uniform guidelines for collecting and reporting data as well as increasing their validity in measuring program performance. ODEP continues to refine data systems in an effort to raise the bar on the quality and nature of performance information reported.
Timely, Accurate, and Relevant Economic Information
Performance Goal 06-1.2A (BLS) — FY 2006
Improve information available to decision-makers on labor market conditions, and price and productivity changes.
Indicators, Targets and Results |
FY 2005
Result |
FY 2006
Target |
FY 2006
Result |
Target Reached* |
Percent of output, timeliness, accuracy, and long-term improvement targets achieved for labor force statistics |
82% |
85% |
79% |
N |
Percent of output, timeliness, accuracy, and long-term improvement targets achieved for prices and living conditions |
87% |
85% |
94% |
Y |
Percent of output, timeliness, accuracy, and long-term improvement targets achieved for compensation and working conditions |
95% |
85% |
77% |
N |
Percent of output, timeliness, accuracy, and long-term improvement targets achieved for productivity and technology |
100% |
85% |
100% |
Y |
Cost per transaction of the Internet Data Collection Facility |
$2.44 |
$2.58 |
$1.82 |
Y |
Customer satisfaction with BLS products and services (e.g. the American Customer Satisfaction Index). |
74% |
75% |
79% |
Y |
Cost (millions) |
$536 |
– |
$573 |
|
*Indicator target reached (Y), substantially reached (S) or not reached (N) |
Goal Not Achieved |
Program Perspective and Logic
BLS is the principal fact-finding agency in the Federal government in the broad field of labor economics. As an independent national statistical agency within the Department of Labor that collects, processes, analyzes, and disseminates essential statistical data to the American public, the U.S. Congress, other Federal agencies, State and local governments, business, and labor, BLS provides information that supports the formulation of economic and social policy, decisions in the business and labor communities, legislative and other programs affecting labor, and research on labor market issues. These important policies and decisions affect virtually all Americans.
BLS reports performance for this goal by producing timely and accurate data, as well as by enhancing its outputs. For example, in order to better meet customer needs for timely and accurate data, BLS improves data relevancy, coverage, and response rates, among other improvements that comprise the BLS indicators.
To continue improving its products and services, BLS analyzes and evaluates new economic and statistical methodologies, new technologies, and new survey design, collection, and dissemination approaches. Keeping abreast of improvements and using them to deliver data in a more timely and useful manner, while still maintaining cost effectiveness, are essential ingredients to meeting our goals and providing the quality of service our customers expect. For example, in FY 2006, BLS accelerated the release of Survey of Occupational Injuries and Illnesses data, which are used by employers, policymakers, and safety inspectors to identify and mitigate potential workplace hazards. BLS also released data that allows users to compare one metropolitan area's wages with over 75 other areas in the United States. In addition, BLS converted two more of its surveys to the North American Industry Classification System, which more accurately reflects new areas of economic growth and technological changes that have occurred in the economy over the past twenty years than the previous classification system.
The costs for this performance goal increased by seven percent between FY 2005 and FY 2006, primarily due to built-in cost increases, including personnel compensation and benefits and other services, and small differences in the timing of certain expenditures.
| In the aftermath of Hurricanes Katrina and Rita, DHS was tasked with developing a plan to rebuild the devastated Gulf Coast region. Becca O'Brien, Director of Policy & Research at the Office of the Federal Coordinator for Gulf Coast Rebuilding, asked BLS to provide data to aid in assessing the cost-effectiveness of protecting various areas around New Orleans. Using geocoded data from the Quarterly Census of Employment and Wages, in which businesses were assigned detailed geographic coordinates, BLS provided Becca with the special tabulations she requested within one day. That evening, at a meeting at the White House, these measures were used to make decisions that impact the future of the Louisiana Gulf Coast. Per Becca, “Our decisions would certainly not have been as well-informed without these data.” BLS also worked closely with mapping experts in California and with the Louisiana Department of Labor to make these tabulations and clear their release. |
 |
| Photo credit: DOL/BLS |
Analysis and Future Plans
BLS reached targets for four of its six performance indicators. BLS reached 79 percent of the underlying targets for its labor force statistics indicator, missing the target by six percentage points. Four surveys missed response rate targets. The hurricanes temporarily depressed response to the Current Employment Statistics program, and legal requirements made it more difficult for the National Longitudinal Survey to contact people in prison or the military. BLS also had difficulties with the response to its Job Openings and Labor Turnover Survey and American Time Use Survey. In the case of the Time Use Survey, a large proportion of nonrespondents stated that their decision not to participate was because of their previous Current Population Survey participation. BLS is continuing efforts to mitigate this problem. In addition, two surveys missed coverage targets. The Occupational Employment Statistics program released fewer estimates than anticipated to avoid the risk of disclosing confidential respondent information. The Local Area Unemployment Statistics program target was based on population estimates from the Census Bureau, which were lower than expected. Finally, the Quarterly Census of Employment and Wages did not publish new Business Employment Dynamics series on unit counts in 2006, as originally planned.
BLS reached 77 percent of the underlying targets for its compensation and working conditions indicator, not reaching its target for this indicator. BLS continues to struggle with response rates, which are dependent on businesses and individuals responding to strictly voluntary questions of an often highly personal or sensitive nature. The Employee Benefits Survey (EBS) and Employment Cost Index both had difficulty with nonresponse, each missing its target by one percentage point. EBS also missed its workload measure for number of benefits plans analyzed. The Locality Pay Survey missed a publication target because five area publications planned for late 2006 will not be published until early 2007. The Census of Fatal Occupational Injuries missed a measure when the size of revisions to the annual count of fatal work-related injuries was slightly higher than targeted. Finally, the Survey of Occupational Injuries and Illnesses missed two of its targets. A decrease in workplace injuries and illnesses that require days away from work led to fewer cases reported by employers. Improved reliability standards reduced the number of publishable national estimates on the characteristics of the worker and the circumstances of the injury or illness.
BLS reached 94 percent of the underlying targets for its prices and living conditions indicator. The International Price Program missed two of its response rate targets and one of its workload targets. BLS reached 100 percent of the underlying targets for its productivity and technology indicator. BLS exceeded its target for decreasing the cost per transaction of its Internet Data Collection Facility — a manageable and secure architecture that survey respondents use to report data. The cost per transaction was $1.82 in FY 2006 — down from $2.44 in FY 2005. The BLS Occupational Outlook Handbook (OOH) website is the Bureau's nationally recognized source of career information. Using the American Customer Satisfaction Index survey, the OOH website surpassed its target of 75 percent in the third quarter of 2006. The BLS score was 79 percent; the aggregated scores for the Federal government and the private sector for the same time period were both 74 percent. For more information, see Study 7, Customer Satisfaction with the BLS OOH Website, in Appendix 2.
PART, Program Evaluations and Audits
Using the Program Assessment Rating Tool in FY 2003, BLS was rated Effective, the highest rating category. BLS resolved the three original PART findings in FY 2005. In January 2006, new follow-up recommendations replaced the ones that were completed. The new recommendations included conducting an independent evaluation of agency effectiveness, developing additional efficiency and cost-effectiveness measures, and establishing more ambitious targets. In response, BLS is examining options for an independent study and plans to begin the evaluation in FY 2007 after it has determined the best course of action. BLS also will continue to work collaboratively with the Department in establishing new efficiency measures and ensuring that its targets are ambitious.
BLS programs are evaluated both internally and externally to ensure that they provide taxpayer value. As required by OMB Statistical Policy Directive #3, the seven BLS statistical series that are designated as Principal Federal Economic Indicators are evaluated on a three-year schedule. In FY 2006, BLS completed performance evaluations for the U.S. Import and Export Price Indexes and the Consumer Price Index (see Study 8 in Appendix 2).
Data Quality and Major Management Challenges
BLS has instituted rigorous, systematic, and comprehensive controls to ensure that all data are of "excellent" quality. For example, the BLS executive team meets with program management on a quarterly basis to discuss progress toward meeting performance indicators. BLS also conducts its own program reviews and contracts for external reviews as necessary. These assessments ensure that survey data are accurate, reliable, and released in a timely fashion; systems and procedures are documented adequately; program performance meets or exceeds standards; and pre-release data are kept confidential.
| |
|