 |
| Yearly Reports |
| Interested in what kind of weather occurred in a recent year? Check out the
most memorable events below. |
|
|
 |
The Impacts of Rita (Page 1 of 2) |
 |
| |
| The tropics continue to be active in 2005. Hurricane Rita
tracked from near the
Florida Keys on September 20th into the central Gulf of Mexico on the
22nd. Before dawn on the 24th, Rita was making landfall near the Texas
and Louisiana line as a Category 3 storm (winds near 120 mph) . |
 |
| In the picture:
Hurricane Rita was just south of the Florida Keys on 09/20/2005. |
|
 |
| In the picture:
Hurricane Rita was headed toward the Texas Gulf Coast on
09/22/2005. |
|
|
| At one point (as of 9 pm CDT on the 21st), Rita had maximum
sustained winds of 175 mph...a Category 5 storm! The minimum central
pressure of Rita was 897 millibars/26.49 inches...making it the third most
intense hurricane (in terms of pressure) ever in the Atlantic basin.
|
| It was thought that, once inland, high pressure would
slow Rita down...with the remnants of Rita stalling in northeast Texas
or northwest Louisiana. This is the same high that brought well above normal
temperatures and near record heat to the region from September 18th
through the 23rd. Afternoon readings were in the 90s to around 100
degrees. |
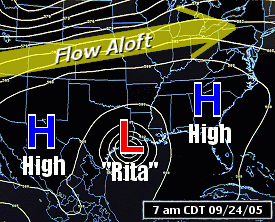 |
| In the picture:
The pattern on 09/24/2005...with Hurricane Rita making landfall near the
Texas/Louisiana line, but blocked to the north by high pressure. |
 |
Given a stalled system, rainfall was expected to be prolonged over several
days...with 20 inch amounts predicted (this even included southwest
Arkansas). As it turned out, Rita did not slow down...and tracked
northward into Arkansas late on the 24th/early on the 25th. |
| In the picture:
A precipitation forecast for the 48 hour period ending at 7 pm CDT on
09/26/2005 (from the Hydrometeorological Prediction Center). |
| The revised forecast called for 3 to 6 inches of
rain in most areas, with lesser amounts across the north and west. This
was actually pretty close. Some of the higher amounts included 4.87
inches at Mount Ida (Montgomery County), 4.72 inches at Hot Springs
(Garland County), 3.90 inches at Texarkana (Miller County) and 3.62
inches at Pine Bluff (Jefferson County). |
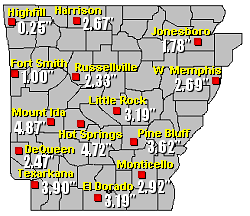 |
| In the picture:
Forty eight hour rainfall amounts as of 7
am CDT on 09/26/2005. |
Below are some other amounts from the cooperative
observer network and automated gauges (4 inches or more). For
even more reports, click here.
|
| Site |
Rain
(inches) |
| Little Rock
Air Force Base (Pulaski County) |
6.30 |
| Ward (Lonoke Co.) |
6.15 |
| Guy (Faulkner Co.) |
6.01 |
| Star City
(Lincoln Co.) |
5.98 |
| Stuttgart
(Arkansas Co.) |
5.90 |
| Arkansas City
(Desha Co.) |
5.53 |
| Malvern (Hot
Spring Co.) |
5.44 |
| DeWitt (Arkansas Co.) |
5.43 |
| Leola (Grant Co.) |
5.37 |
| Damascus (Van
Buren Co.) |
5.20 |
| Lewisville
(Lafayette Co.) |
5.08 |
| Camden (Ouachita Co.) |
5.05 |
| Cabot (Lonoke Co.) |
5.00 |
| Benton (Saline
Co.) |
4.94 |
| Elaine
(Phillips Co.) |
4.94 |
| Sparkman
(Dallas Co.) |
4.91 |
| Fordyce
(Dallas Co.) |
4.87 |
| Rowher (Desha Co.) |
4.87 |
| DeGray Dam
(Clark Co.) |
4.83 |
| Antoine (Pike
Co.) |
4.70 |
| Ferndale
(Pulaski Co.) |
4.70 |
| Clinton (Van
Buren Co.) |
4.64 |
| Narrows Dam
(Pike Co.) |
4.59 |
| Blakely Mtn Dam
(Garland Co.) |
4.58 |
| Center Ridge
(Conway Co.) |
4.51 |
| Clarendon
(Monroe Co.) |
4.45 |
| Nashville
(Howard Co.) |
4.20 |
| Sheridan
(Grant Co.) |
4.13 |
| Wooster
(Faulkner Co.) |
4.11 |
| Hampton
(Calhoun Co.) |
4.03 |
| Perry (Perry Co.) |
4.00 |
|
|
|


